

A complete guide to the symbols shown in entity-relationship diagrams (ERDs).
Although data modeling became a necessity around the 1970s, there was no standard way to model databases or business processes. Many solutions were proposed and discussed, but none were widely adopted.
Peter Chen is credited with creating the ER (entity-relationship) model, which introduced a way of mapping data model elements (which would become database elements) and their relationships. This model can serve as the diagram as well as the documentation for a database project.
Today’s developers use ER diagrams and symbols like a universal modeling language for software engineering projects. However, ERD symbols have several characteristics, each having a different representation. This article will present and explain some of the most important ones (using Vertabelo to demonstrate them) and will reference conceptual, logical, and physical modeling concepts.
What Is Data Modeling?
Data modeling is a method for establishing a database's business rules and data structures. It is an integral aspect of the information system development cycle and crucial to the project's success. It involves building the information system and emphasizing the logical entities and their logical connections. It entails a sequence of theoretical and practical applications to develop a data model that is consistent, non-redundant, and perfectly suitable to any modern database management system (DBMS).
Conceptual modeling is based on the highest level of presentation of business rules. Therefore, it should be used to engage the customer, since the emphasis is on discussing the client’s business elements. In addition, the data modeling examples presented in the conceptual model are easier to comprehend: there are no limits or particular technological applications.
A conceptual diagram should be straightforward; it is meant for consumers. Some database design tools do not support conceptual models; in Vertabelo, you can simply creating a logical model and leave out the details and you’ll have a conceptual data model.
The logical model considers certain constraints and incorporates features like pattern matching and naming, primary and foreign keys, normalization, and referential integrity.
Finally, the physical model considers the limitations imposed by the target DBMS. It should always be based on the logical model, but it will have data types and other features for that specific database engine.
Now that we understand what data modeling is, let’s talk about the types of objects represented in ER diagrams.
ER Diagram Elements
Entities
Entities – the items involved in a domain – can be physical or logical. This is based on their reality in the actual world. Physical entities are observable in the real world, such as a consumer or a product (a car, a computer, or an item of clothing). Logical entities, on the other hand, often arise from interactions between or with material things that make sense inside a particular business area. They are not tangible objects in the external/real world (i.e. they do not occupy a space). A sale or the categorization of an object (i.e. by model, species, user role) is an example of a logical entity.
Entities are named with concrete or abstract nouns that represent their function within the domain. Practical examples of familiar entities in various systems are Customer, Product, Sale, Class, and Role, among others.
We can classify entities according to the reason for their existence:
- Strong entities are those whose existence is independent of other entities; that is, they can exist by themselves. In a sales system, the Product entity is independent of any other existing entities.
- Weak entities depend on other entities to exist; individually, they make no sense. For example, the Sale entity depends on the product entity because a sale without items makes no sense.
- Associative entities arise when there is the need to associate an entity with an existing relationship. In entity-relationship modeling, a relationship can't be associated directly with an entity when the cardinality is ..n, or many-to-many. Thus, we make this relationship an associative entity, which can relate to other entities. To better understand this concept, consider a sales application with the entities Product and Sale. They have a many-to-many relationship, since there can be several products in one sale and a product can be sold in several sales.
Attributes
Attributes describe entities. They are the fields in an entity, and they represent characteristics. You might say they are analogous to the columns in a database or a spreadsheet. For a Customer entity, the attributes would include their ID or account number, name, email address, etc. An entity called Person would have attributes like Name or Birthday.
Keys
In a database, keys are used in several ways. The most common is to identify an instance of an entity (unique key and primary key) and to link two entities together (foreign key).
A primary key (PK) uniquely identifies each row in a table; in a data model, it identifies each instance of the entity. For example, the AccountNumber attribute would uniquely identify each customer in the Customer entity. Primary keys can be made up of multiple attributes if no single attribute can identify each instance. A common example is a street address; you might have many houses with the number 11 and many houses on Main Street, but there is only one 11 Main Street per town.
A unique key is an attribute that could identify each row in a database or instance of an entity. You can have several unique keys in a table/entity, but only one primary key.
A foreign key (FK) is an attribute that’s ‘borrowed’ from another entity. They are used to show the relationship between two entities. Usually, we use the primary key from one table to link to another table. An example is a CustomerID attribute (the primary key of the Customer entity) appearing in the Order entity. This indicates which customer placed the order and links the order with the customer – and the Order entity with the Customer entity.
Finally, it’s good to note that primary keys are called “primary integers” (PI) in the earlier stages of data modeling. But we’ll call them primary keys to avoid confusion.
Relationships and Cardinality
Relationships are connections between entities that specify a correlation between them. Based on the number of items on either side of the link (the cardinality of the relationship), we may categorize them in one of three ways:
- .1 (one-to-one): Each of the two entities must reference precisely one instance of the other. In a resume database, for example, each registered user is limited to one resume, and each resume belongs to a single registered user.
- .n or 1..* (one to many): One entity can reference many instances of the other; however, each of the multiple units mentioned can only be connected to a single unit of the other entity. For example, a health insurance plan has several dependents, but each dependent can only be associated with one primary user. Note that just two entities are involved: the user and the dependent. What differs is the quantity of units on either side.
- .n or *..* (many to many): Each entity on both sides can reference many units of the other. In a library system, for instance, several authors can collaborate on one title, while a single author can produce multiple titles. Therefore, an author-type object can make innumerable references to title-type objects and vice versa.
Relationships are often denoted by verbs or idioms that convey how two things interact or the influence one has on the other. This terminology may vary based on the reading direction of the connection. For example, one author writes many books, but a book has multiple writers.
Association
A binary association describes a link that occurs between classes. However, a class can also be linked to itself (a unary association) and an association can be shared by more than two classes, (ternary or N-ary association).
In an ERD, associations use straight lines connecting the classes involved; these arrows may or may not have pointers on the extremities indicating the navigability of the association (the direction in which information is passed between the classes) and the mandatoriness of the association. If there are no arrows, communication can flow between all classes in the association.
The most common way to implement association is to have one object as an attribute of another (during code implementation). ERDs can be used to represent class diagrams, too. In Object-Oriented Programming (OOP), when you implement an entity – even if they are separated entities – you can use one object as attribute of another to represent association.
Inheritance
Inheritance is one of the basic foundations of the object-oriented paradigm. It allows classes to share attributes and methods by defining a class hierarchy where subclasses inherit elements from the parent class (also called the superclass). The most common use of inheritance in object-oriented design is to allow code reuse by generalizing behavior or specializing operations and attributes.
Tables
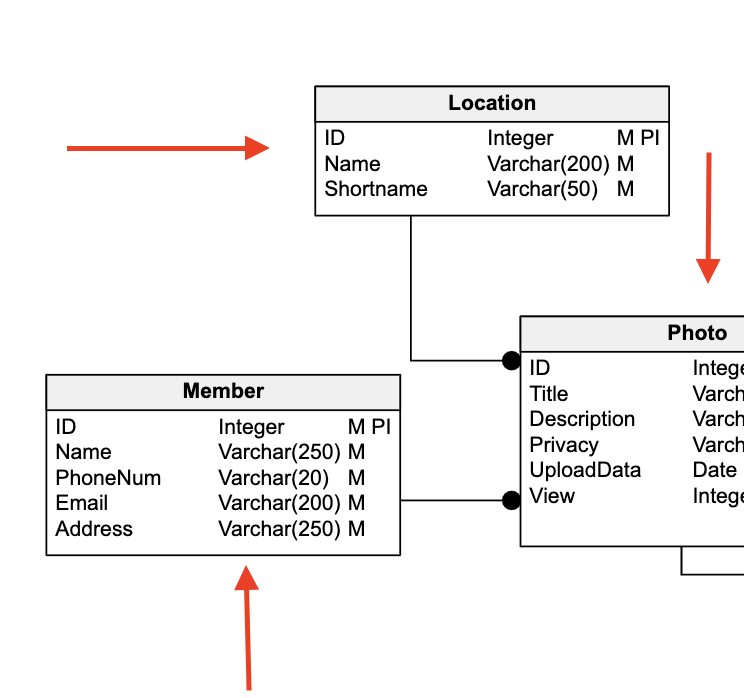
A table is a structure used to organize information about a specific subject. This data can be qualitative (relating to characteristics and attributions) or quantitative (referring to numerical values). Unlike entities, tables are used in the physical modeling of the database. Composed of rows and columns, they store the data in a structured way so we can access the information through a specific coordinate system.

The table (indicated by the red arrows) depends more on the definition of the data types inserted. It helps the reader absorb data knowledge and facilitates various ways to illustrate and summarize the information presented.
The main difference between a table and an entity is theoretical: an entity represents concepts of the system objects, while a table represents its physical structure, which is associated with a database.
Data Modeling Languages and Their Symbols
So, we know the function of the different elements in a data model. Let’s now talk about some of the specific modeling languages that you often see in an ER diagram.
Crow's Foot
This is the most widely used notation among data architects. It uses rectangles to represent entities, lines to represent relationships, and symbols at the ends of the lines to represent cardinality. The “many” cardinality is represented by a trident or crow's foot.
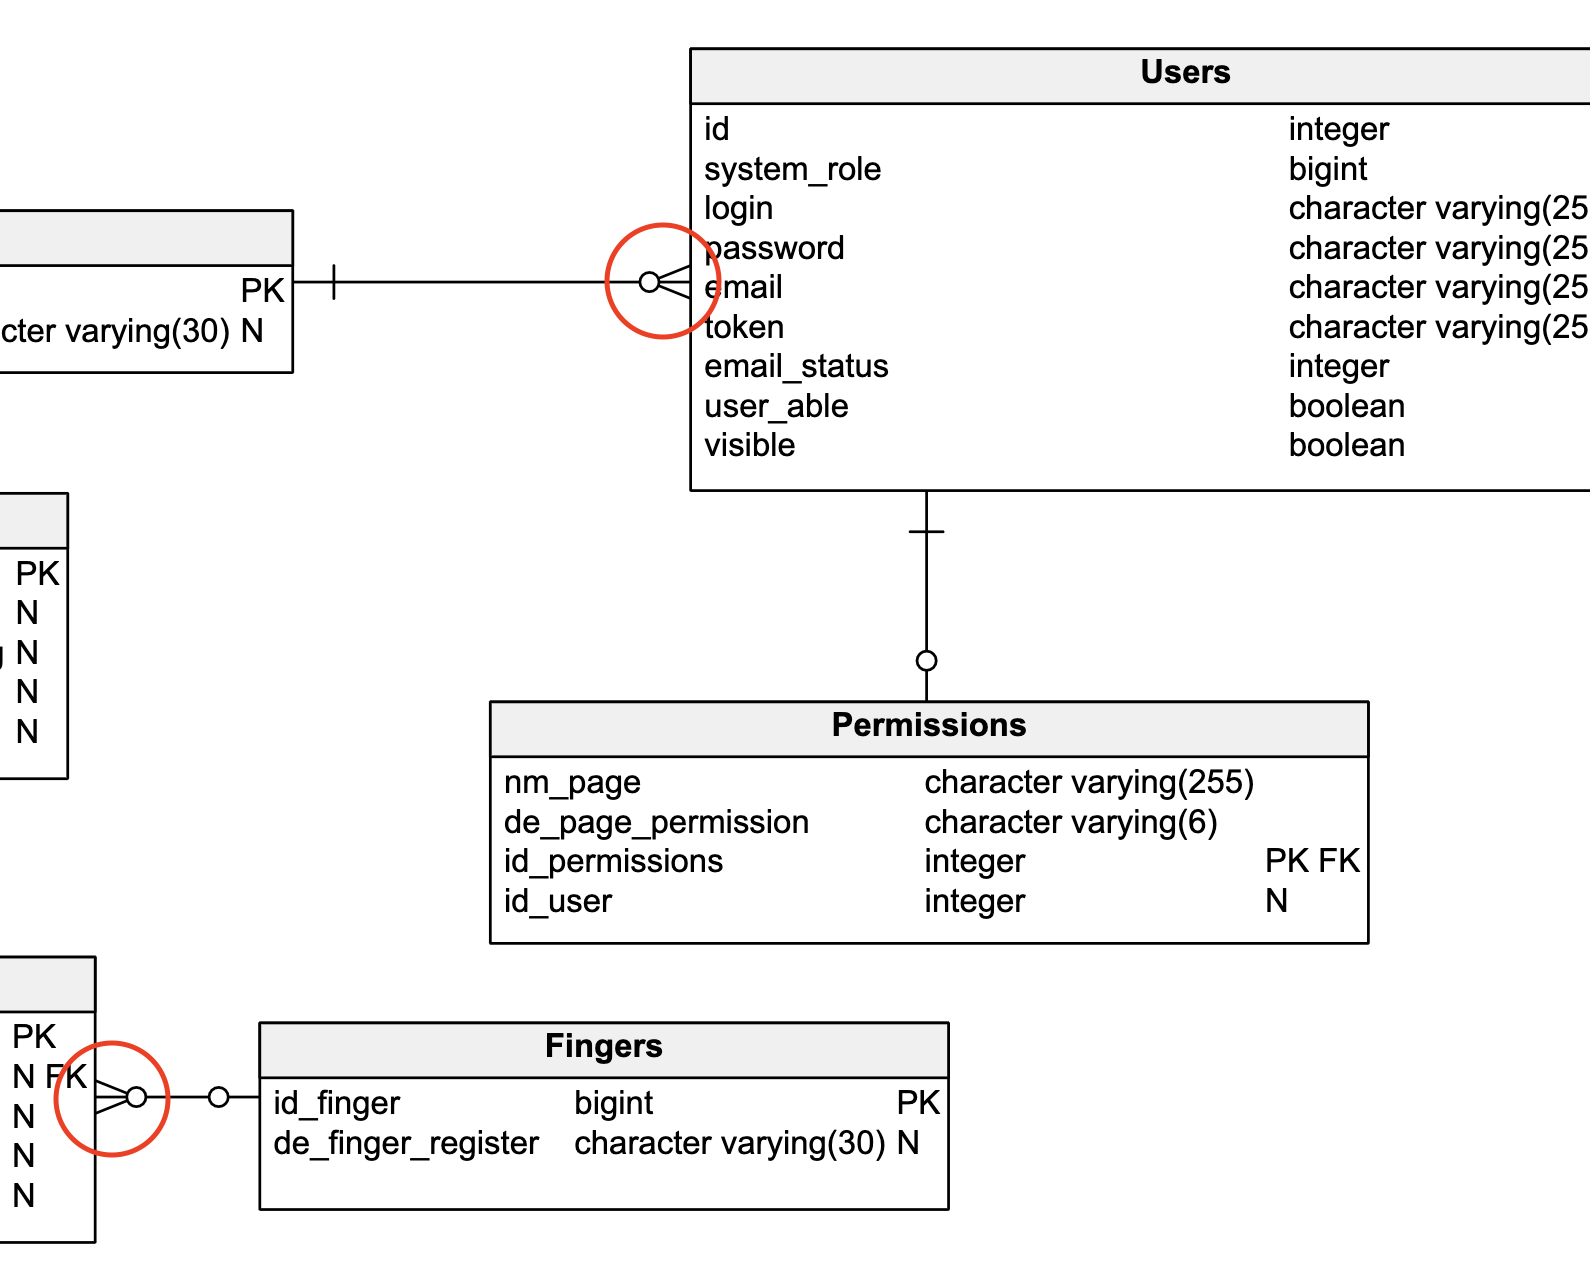
The red circles indicate the notation – in this example, of a physical model for a biometric system.
IDEF1X
IDEF1X is a language and method for information modeling published as a North American standard by NIST (1993). The language was already in use before the standard.
The basic syntactic constructs are entities, relationships, and attributes. Entities are represented as rectangles with a horizontal dividing line, just as in Crow’s Foot. IDEF1X entities can be dependent (represented by rectangles with rounded corners) or independent (represented by rectangles with sharp corners). An entity is dependent when its key (also known as the primary key) contains the complete key of at least one other entity.
An entity’s key consists of one or more attributes whose value identifies an occurrence of the entity. The key attributes are written above the entity rectangle’s horizontal division.
As you probably noticed, a major difference between the Crow’s Foot and IDEFX1 notations is how they represent cardinality. IDEFX uses letters as well as shapes to denote the direction and type of cardinality. You can learn more about the differences between IDEFX1 and Crow’s Foot notation here.
UML
UML (Unified Modeling Language) is an object-oriented data modeling language used to describe, construct, display, and document a software system. It enables visual modeling so that the relationships between system components may be better viewed, comprehended, and recorded.
UML has six kinds of structural diagrams, one of which is the class diagram. This diagram is essential for object modeling and representing the system's static structure; they can depict, describe, and record structural aspects of models.
During the analysis and design phases, class diagrams capture and define the class and other classifier structures. They specify the connections between classes and classifiers, using characteristics, actions, and signals to depict model design. A single class diagram can describe a complete system, or numerous class diagrams can be used to depict the system's components. It all depends on the class or component’s complexity.
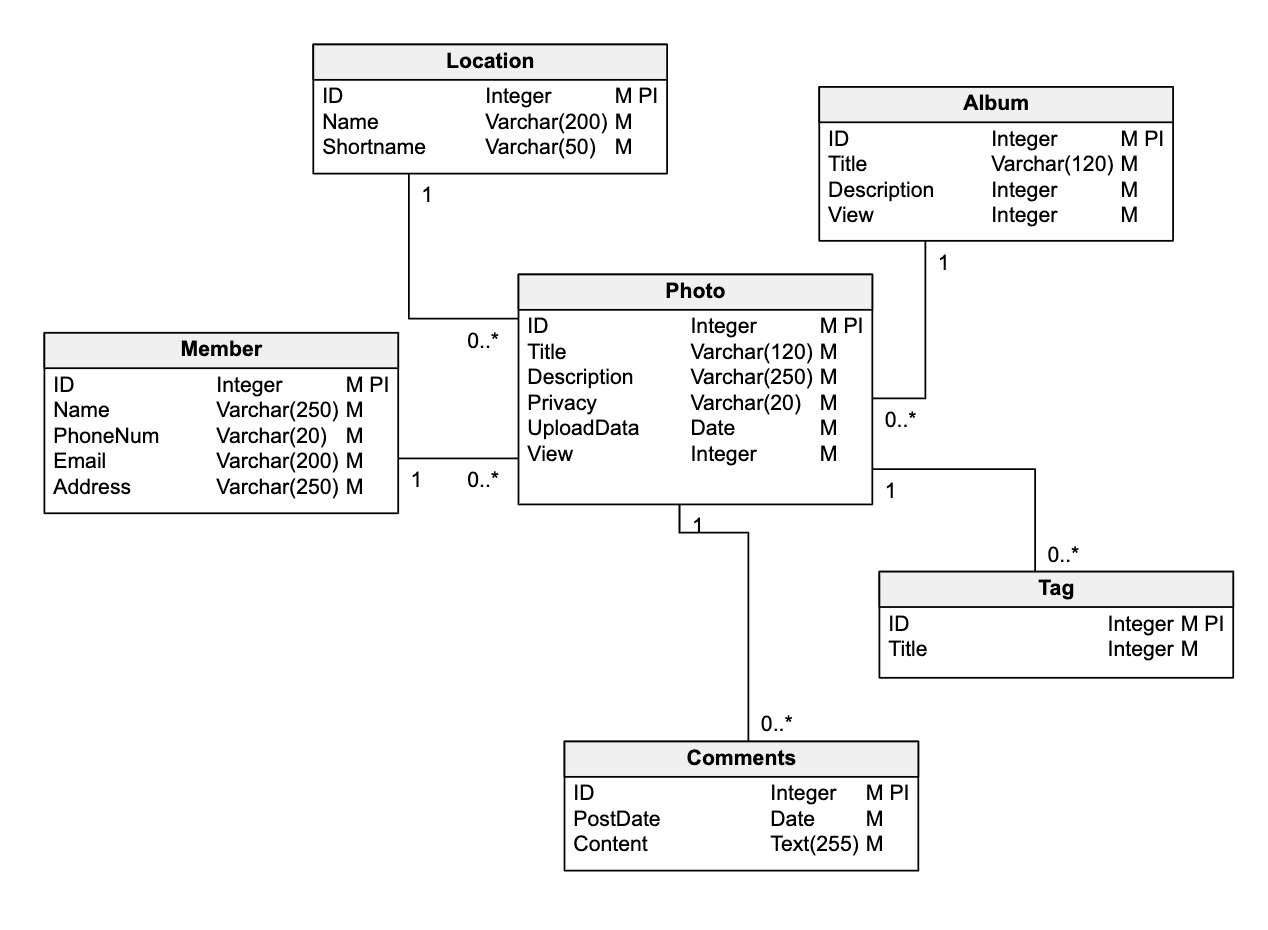
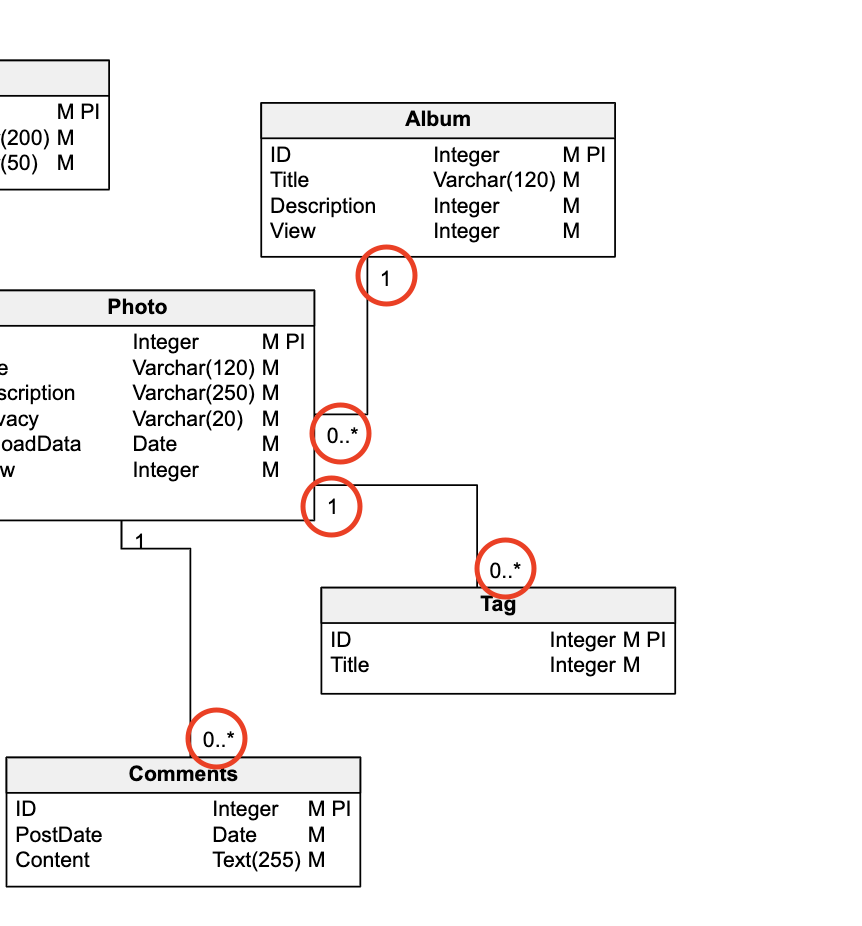
In this figure, the squares represent entities, lines the relationships between them, and numbers the cardinality of those relationships. The model elements in class diagrams are as follows:
Classes
In UML, a class represents an entity or a group of objects with similar structures and behaviors. Classes and their instances are frequent model components in UML diagrams.
Objects
Objects are model components that represent instances of a class (or classes). In a model, you may insert objects to represent prototypical instances. A concrete sample depicts a real-world individual or object. For example, a concrete instance of the Customer class represents a real customer. A prototype instance of the Customer class describes a typical customer with its data.
Packages and Signals
Packages organize model pieces of all kinds, including other packages.
Signals are model components independent of the classifiers that handle them. Signals define the asynchronous, unidirectional communication between active objects.
Enumerations
Enumerations are model components that represent data types. Enumerations comprise collections of named identifiers that represent the enumeration's values. These are known as enumeration literals.
Data Types
In UML diagrams, data types are model components that describe data values. Data types often represent primitive kinds (such as integer or text types) and enumerations (including user-defined data types).
Artifacts
Artifacts are UML model components that represent physical entities. Artifacts include executable files, libraries, software components, documents, and databases.
Relationships
A relationship in UML is a link between model elements. It defines the structure and behavior of model components by including model semantics.
Barker's Notation
Barker’s notation is a variation of the Crow’s Foot ERD notation. It was developed by Richard Barker and other CACI employees in the early 1980s. When Barker joined Oracle, it became the standard notation for Oracle CASE modeling tools.
This notation uses some different symbols than Crow’s Foot. In an entity, "#" represents the primary key, "*" a mandatory attribute, "o" an optional one. Mandatory relationships are represented by a solid line, while optional relationships are represented by a dotted line. The cardinality indicators are the same as in Crow’s Foot.
Now That You Know Database Diagram Symbols …
Data modeling and creating database diagrams is more than just symbols on a screen. It requires a deep understanding of the business domain and how information can be stored, queried, and used. If you want to learn more about data modeling, check out the data modeling articles on our blog. You can also study our example data models (with explanations) for more ideas.
