

Project management is a booming field. In this article, we’ll examine a data model to support a project management app.
Project management is anything but an easy task. You are limited in many ways – materials, costs, human resources, and project deadlines spring to mind – but it’s still up to you to deliver a result on time.
If you think of building a pyramid, you can easily conclude it was a case of project management! It had a project sponsor (usually Pharaoh), a deadline (Pharaohs’ deadline ☺), human resources (mostly workers and slaves), material resources (stone blocks) and of course a project manager. A lot has changed since then, but the idea is still the same. We need to be as organized as possible if we expect to deliver a project result on time, up to its expected quality, and within its budget.
In this article, we’ll describe a data model that could run a project management application.
A Short Introduction to Project Management
Before we take a look at the model, we need to get some background on project management. I’ll run through some of the most popular terms and describe features that our application should include.
-
What is a project?
A project is a time-limited effort that, if completed successfully, will create something new and valuable.
In the introduction, we compared project management to building a pyramid. Nowadays, project management can mean building roads or cities, developing new software, defining new methodologies, etc. All of these imply that the project will deliver something completely new (or an improved version of something else).
-
What is project management?
Project management is the process of accomplishing a predefined goal within a set time period and budget. It requires a varied group of techniques, skills, and tools.
During the project management cycle, we’ll create and implement a plan for our project. We’ll track progress throughout. In some cases, we’ll have to make changes to cope with unplanned situations and events. If that happens, we’ll need to reallocate resources to critical activities and tasks in order to stay on schedule; in a worst-case scenario, we may have to alter our project plan.
In a perfect world, we could deliver project results on time, on budget and with the right quality. In real life, we need to balance scheduling, budgeting and quality during the entire process. This is where utilizing a Gantt chart template can provide a structured visual representation, helping to effectively manage these aspects and ensure project success.
-
What are some project management terms I need to know?
There are a few popular project management approaches (Lean, PRINCE2, process-based, traditional, etc.) but we won’t go into these now. I’ll stick to the terms that are common in most project management methodologies. Some of these terms are:
- Project stakeholders – All private individuals or business entities that are interested in the successful finishing of the projects. This includes the clients or sponsors of the project, but it can also include user groups, government agencies, and people who work on the project, among many others.
- Project manager – The person in charge of planning, executing, and closing the project. Project managers should be properly educated in the field; they should also be able to use various techniques and tools to fulfill their role.
- Activity – A single action that produces a “small” result. An activity is usually related to other activities. Some can run simultaneously and independently of each other; others must wait until some previous activity is completed. For example, ordering needed software is an activity.
- Task – A group of related activities that produces a “larger” result. If we complete all project tasks successfully, we’ll also close our project successfully. So, after the ordered software is delivered (1st activity of the task) we can install it (2nd activity on the same task) and see if it works as expected (3rd activity). Once we’ve completed all these activities, we’ve also completed this task.
- Critical path – A sequence of related activities that have no time buffer. If any activity on that path requires more time than allotted to it, we’ll need to respond in some way. This could mean modifying our plan, reallocating resources, decreasing quality, or extending the whole project.
- Gantt chart – A graphical representation that is often used to track project progress. The Gantt chart clearly displays all tasks, activities, planned resources and budgets, activity and task statuses, critical paths etc. The X-axis is the time axis (usually measured in weeks) and the Y-axis shows the project tasks and activities.
-
What should project management software look like?
Project management software should be as simple as possible. It would be best to have the entire Gantt chart on one screen. We can expect that we’ll still need to scroll to see various parts, but we’ll have everything clearly visible on a single screen.
The Data Model
The data model consists of three main subject areas:
- Users and roles
- Projects
- Tasks and activities
I’ll explain the Users and roles and Project and partners subject areas first. Then we’ll move to the Task and activities subject area, which is the central part of this model.
Section 1: Users and Roles
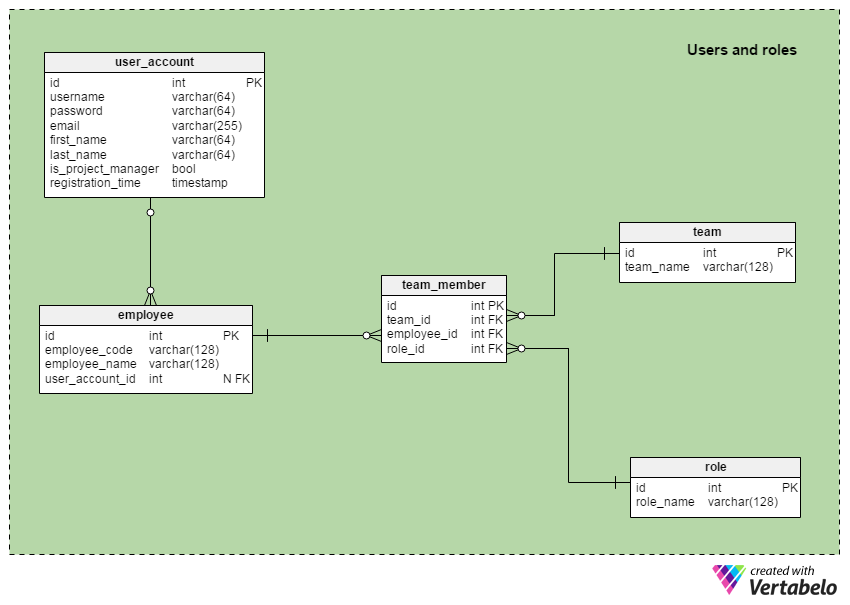
This section contains all the tables needed to store details about app users, project teams, and team members and their roles.
Some of the employees on our project will be able to log into our application, but most will not need to. Therefore, we need two separate tables: the user_account table and the employee table.
The user_account table contains everything we need to know about the app users. We’ll store the username and password needed for login and personal details like first_name, last_name, and email. The username and email values are UNIQUE in this table. The is_project_manager flag indicates if the user has the authority to make changes on the project. The last attribute in this table is the self-explanatory registration_time.
As I’ve already mentioned, any user with login rights could participate in the project, but that is not the requirement. On the other hand, most of the employees on the project won’t have login rights. Still, we need to store their details in order to relate them with tasks and activities. A list of all employees that are part of any project is stored in the employee table. The employee_code attribute is the alternate UNIQUE key of the table. The employee_name attribute stores the first and the last name of all employees on the project. If the employee has login rights, his user_account_id attribute will have his related ID number from the user_account table.
We’ll usually assign individual employees to a certain task or activity. There are some situations when we’ll use an entire team to complete a certain activity. In these cases, it would be wise to group all members of that team. Otherwise, we risk assigning activities to each employee separately. The team_member table serves that purpose in our model. We’ll store team_id, employee_id and role_id for all employees in a given team. Notice that employees can be assigned to a team only once; therefore the team_id – employee_id pair forms the UNIQUE key of this table. On the other hand, an employee could be a member of several teams.
The remaining two tables in this section are dictionaries. The team table lists all teams we’ve defined in our organization, while the role table lists all the roles that could be assigned to employees on the project. For example, some roles in a software development company are developer, consultant, and project manager. In both tables, the name attributes can contain only UNIQUE values.
Section 2: Projects
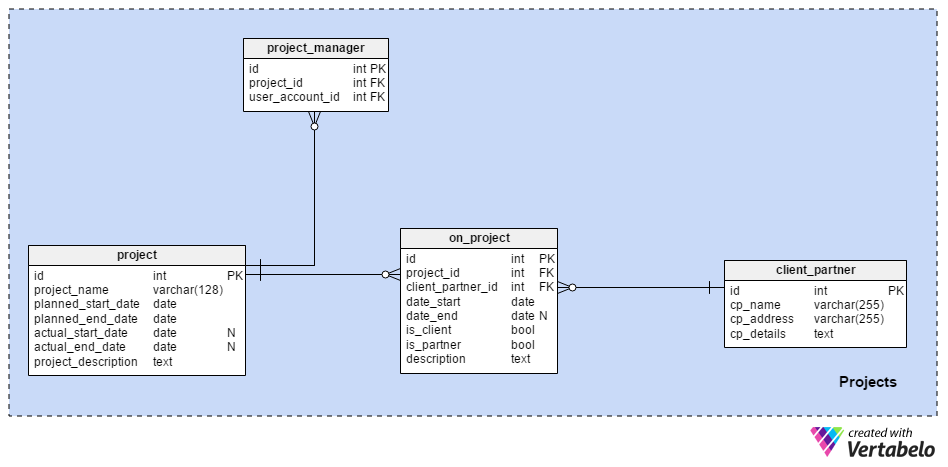
In the first section we defined the human resources needed to execute projects. In this section we’ll explain the structure needed to organize project details, partners, and clients.
The most important table in this section is the project table. It is where we’ll store all the projects we’re using our application to manage. For each project, we’ll include the following attributes:
project_name– is the actual project name. It is NOT UNIQUE because we could have two projects with the sameproject_name. We differentiate between them according to their start and end dates.planned_start_dateandplanned_end_date– are the expected start and end dates for the project. These are inserted during the planning phase.actual_start_dateandactual_end_date– are the project’s actual start and end dates. They are inserted during the project execution phase.project_description– is a text description of the project, with all the relevant details.
In the project_manager table, we’ll store a list of all users who can manage projects, create new tasks and activities, assign employees to tasks and activities, and modify or delete existing tasks and activities. To assign a user as the manager of a certain project, that user should have the user_account.is_project_manager attribute set to True. The project_id – user_account_id pair holds only UNIQUE values.
Project stakeholders are all entities that have an interest in the successful completion of the project. These could be investors, government agencies, NGOs or not-for-profit organizations, etc. We’ll also likely work with clients, to whom we’ll deliver the project result. We’ll store these interested parties in the client_partner table. For each client or partner on any of our projects, we’ll store a full name, address, and other text details.
The last table in this section, the on_project table, relates clients and partners with projects. The attributes in this table are:
project_id– is a reference to theprojecttable.client_partner_id– is a reference to theclient_partnertable.date_startanddate_end– are the dates when the client/partner started and ended their engagement on that project. Thedate_endattribute can be NULL because we’ll update its value when the engagement ends.is_clientandis_partner– are flags to denote the role of the entity from theclient_partnertable. Only one of these should be set at the same time.description– is a detailed explanation of the client or partner’s role and engagement in the project.
Section 3: Tasks and Activities
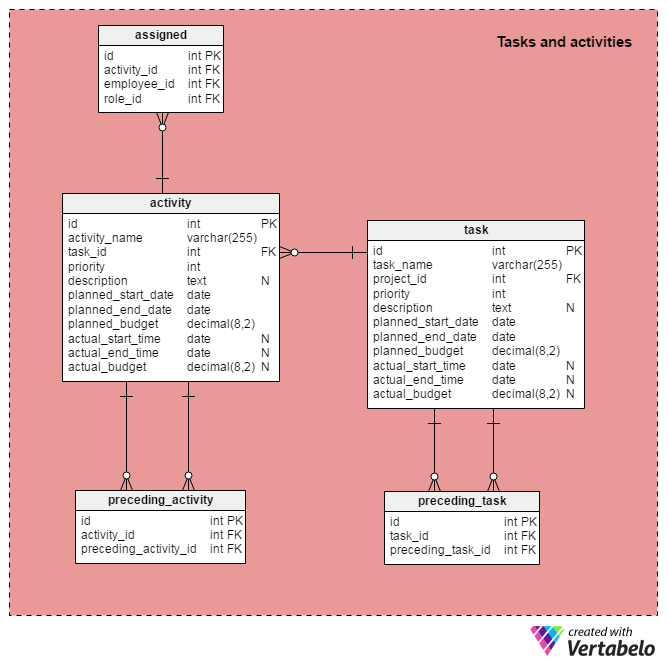
The last section in our model is also the core of our application. We’ll define tasks and activities here, relate them together, and relate them to other parts of the model.
A project is composed of multiple tasks and each task is composed of one or more activities. The task table will store the following details for each task:
task_name– is the task’s onscreen name.project_id– references the project that the task is part of.priority– prioritizes the task with an integer value. We can expect a range of numbers (e.g. 1 to 5) to show the task’s priority within the project. This could be crucial information when you have to decide which tasks to start at what time.description– is a detailed task description, if needed.planned_start_date,planned_end_dateandplanned_budget– are initial values for the task. These are set in the planning phase.actual_start_date,actual_end_dateandactual_budget– are the actual values for the task’s start, end, and budget. These are set during the execution phase, as they are completed.
Project tasks generally are done in order. One or more tasks may have to be finished for a new task to start. A list of all such prerequisite tasks is stored in the preceding_task table. We’ll define the task_id and preceding_task_id attributes here. The “preceding_task_id” attribute will store the ID of whatever task is immediately before the current task. The task_id – preceding_task_id pair forms the alternate UNIQUE key of this table.
Each task is composed of one or more activities. The activity table is very similar to the task table. The attributes in this table are:
activity_name– is an activity’s onscreen name.task_id– references the related task.priority– uses a range of integers to denote the priority of that activity within its task.description– is a detailed activity description, if needed.planned_start_date,planned_end_dateandplanned_budget– are initial values set for that activity in the planning phase.actual_start_date,actual_end_dateandactual_budget– are the actual values, entered once the activity is completed during the project execution phase.
Like tasks, activities may be ordered in a certain way, so we’ll need another table to store prerequisite activities. In the preceding_activity table, the activity_id – preceding_activity_id pair are UNIQUE.
The last table in this section (and in the model) is the assigned table. It is simple but very important. It relates employees with activities. When we assign an employee to a certain activity, we’ll also define their role (via role_id) for that activity. Since activities are the smallest job unit, the same employee can’t be assigned to the same role in the same activity more than once.
We could assign a whole team to a certain activity, but the result would be the separate insertion of each team member into the assigned table. We could also assign an employee or even a team to an entire task but the database will store that information as employees assigned to single activities.
How Can This Project Management Data Model Be Used?
I hope that after reading this article you have at least a general idea of how you could build a project management app. I focused on the Gantt chart because it’s one of the most popular chart types for project management. Still, it’s not the only option we could use. We could go with some other graphical or textual representation. Charts are nice and clear, but what happens if your display size is limited? In that case, a simplified graphical or even textual application could be a reasonable option.
Help Improve This Model!
Project management is a really complex area. There are some different concepts and methodologies, but the main idea is the same. In this example, I went with the Gantt chart because most of us are visual types. On smaller projects, we might use a simple text-only To-Do List. In other cases, maybe the Gantt chart isn’t the best choice.
Please share your experience about the project management tools you’ve used, what you loved about them, and what you wanted to change. These suggestions could help us to improve this model significantly.
