

In this article, we’ll walk you through the steps of creating an entity-relationship diagram (ERD). We’ll explain when you need to use an ERD and what notations and tools are used to build ER diagrams.
An entity-relationship diagram (or ERD) is a visual representation of entities and their relationships in a database. ERDs are created during the data modeling phase of software development, where database designers plan and organize data structures.
Data modeling is an essential step in the software development lifecycle, as it ensures that the data is organized logically and efficiently.
When Do I Use an Entity-Relationship Diagram?
During the data modeling phase, ERDs are built so we can identify entities, attributes, and relationships and plan the overall structure of a database.
The information stored in an ERD is critical for ensuring that the database will meet the needs of the end-users and business stakeholders. By investing in proper data modeling, software project teams can ensure that data is managed effectively; this leads to better performance, scalability, and data quality.
When creating a database, you don’t start with building an ERD and then implementing the database. There are more steps involved during the database design phase, and an ERD is just a tool. ERDs are useful in various stages of a software development project. Here are some specific scenarios where using an ERD is a good practice:
- When gathering requirements for a new system: ERDs can help you identify what data needs to be captured, how it should be organized, and how it is related to other data entities. This will allow you to ensure that the database is designed to meet the specific needs of the new system.
- When communicating with business stakeholders: ERDs are a visual representation of the database structure, making it easier for non-technical stakeholders to understand the data structure and how it relates to their business processes. This can help ensure that everyone involved in the project has a clear understanding of the database structure and how it will be used.
- When designing and debugging a database: During both the design and debugging process, ERDs can be used to identify issues like missing or redundant data that may be causing errors in the system. By using ERDs to identify these issues early on, we can prevent them from causing more significant problems in the future. Such problems can be very costly, especially if the applications are already in production.
- When documenting a database: Because an ERD is a visual tool that documents a database, it ensures that everyone involved in the project has a clear understanding of the database structure and how it is being used. This can be valuable in helping to maintain and update the database over time, as well as to communicate with stakeholders about the database structure.
What Are the Phases of Building an ERD?
When building an ERD, we go through different phases involving business and technical stakeholders. However, to have a common language and model to discuss, we don’t start our ERD in its most detailed form. Instead, we ‘start small’, outlining our ERD and taking it through the necessary phases of conceptual, logical and (finally) physical data models.
In the conceptual model, we identify and define the entities, attributes, and relationships that are relevant to this database. We also establish the rules and constraints that will structure the data. The main goal is to talk to the business stakeholders and create a common high-level understanding of the data and the way it’s organized.
In the logical model, we will improve and add details to the conceptual model. This will involve expanding the entities and defining the attributes. We also determine the relationships between the entities as well as the integrity constraints.
In the physical model, we design the actual database schema for a specific database engine. Here we include things like database-specific data types, indexes, and other physical characteristics of tables and columns. We also look at performance aspects, like optimizing for reads, writes, or a mix.
What Are the Components of an ER Diagram?
Because the ERD is a valuable tool for understanding the database structure and how the data is related, the diagram can become complex. But every ERD is built using simple and essential components. And because it must be understood and approved by stakeholders with different levels of technical knowledge, it relies on graphical representation to communicate these complex topics.
The key components of an ERD are entities, attributes, and relationships.
What Is an Entity?
Entities are the main elements in an ERD; they represent concepts or objects from the real world. Examples of entities include people, places, things, and events.
What Is an Attribute?
The main difference between entities and attributes is that entities represent the outline of the object we’re describing, whereas the attributes fill in the details. For example, an employee entity may have attributes like name, age, and salary.
What Is a Relationship?
To tie together entities that are connected to each other in the real world, relationships between entities are created. These represent the real-world associations between the entities. Examples of relationships include "is a" (e.g. "a car is a vehicle"), "has" (e.g. "a car has a driver"), and "part of" (e.g. "a car is part of a fleet").
What Are Entity-Relationship Diagram Notations?
There are numerous online tools that can help you design a data model. All of them feature at least one system of graphical objects that represent different elements of an ERD. These are called ERD notations, and they are essential features of any data modeling tool. They represent all the necessary information visually.
Each notation has its own specifics, but are all used to represent the same information. However, you don’t have to worry too much about picking one and having to redo the entire ERD later if you have to switch notations. Vertabelo allows you to change ER diagram notations for existing diagrams without having to recreate them.
Let’s go over the main ERD notations.
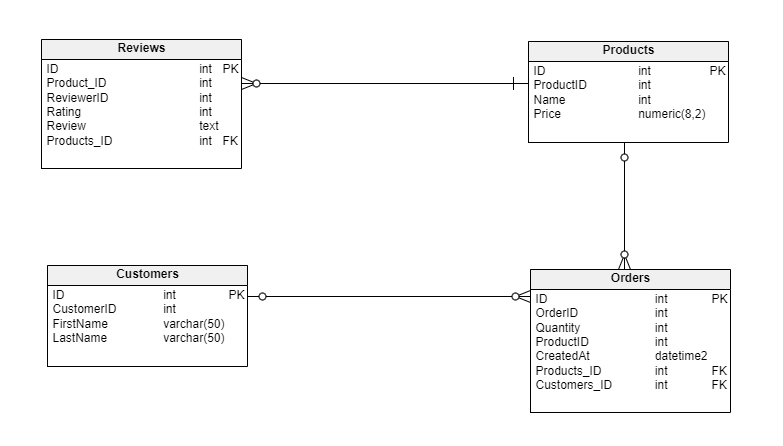
Crow’s Foot Notation
This is a popular ERD notation that uses rectangles to represent entities, text inside the rectangles to represent attributes, and lines to represent relationships. It uses the "Crow's foot" symbol to represent cardinality and shows how many entities can be associated with one another. This notation is widely used in many popular database management systems.
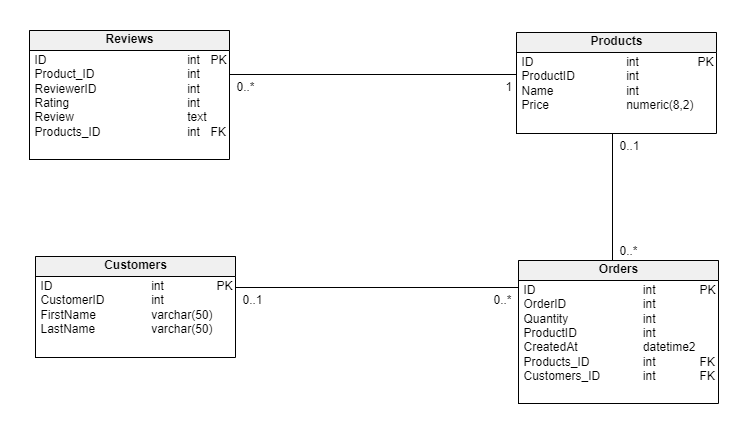
UML Notation
The Unified Modeling Language (UML) is a standardized language used to design and model software systems. UML includes a notation for ERD, which is based on class diagrams. In UML ERD notation, entities are represented by classes, attributes by class properties, and relationships by associations. The notation uses arrows to represent cardinality and shows how many entities can be associated with one another. The UML notation is commonly used in software engineering and is supported by various modeling tools.
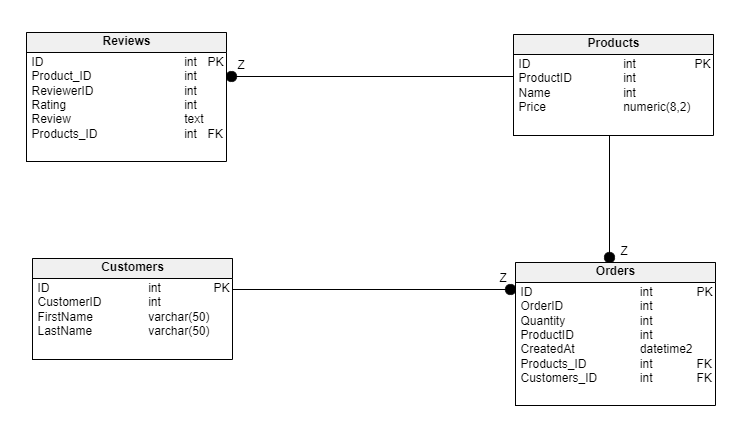
IDEF1X Notation
The Integrated Definition for Data Modeling (IDEF1X) notation is a standardized notation used to model databases in the US government. This notation is similar to the Crow's Foot notation, but with some differences in the way entities and relationships are represented.
In IDEF1X notation, entities are represented by boxes with rounded corners, and relationships are represented by lines with diamonds at the ends. The notation also includes various other symbols to represent constraints, primary keys, and foreign keys. This notation is commonly used in government and military projects.
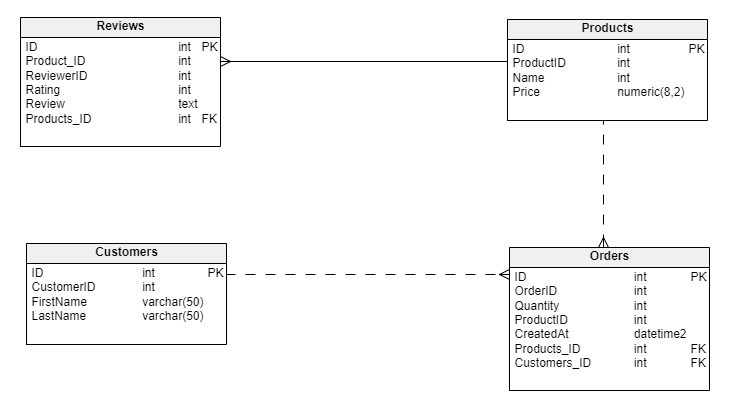
Barker’s Notation
Barker's Notation is an entity-relationship modeling notation developed by Richard Barker in the early 1990s. It is based on the information engineering approach to database design and uses symbols similar to those used in flowcharting. Entities are represented by rectangles, attributes by ovals, and relationships by lines. Crow's feet symbols are used to indicate cardinality.
Barker's Notation also uses color to represent entity types and includes symbols to represent various types of constraints. While less widely-used than some other notations, it is a useful option for those who prefer a more visual and intuitive approach to database design.
ERDs Are Essential to Database Design
In conclusion, database modeling is an essential part of the software development process, allowing developers and stakeholders to design, organize, and visualize the relationships between data entities. By using ERD notations such as Crow's Foot, UML, IDEF1X, and Barker's Notation, designers and developers can create graphical representations of database schemas that are easy to understand and communicate.
With the help of database modeling tools like Vertabelo, it is possible to ensure that your database meets the needs of the business, is scalable, and can be easily maintained and updated. For anyone interested in software development, database modeling is a fundamental skill that is critical to the success of any project.
