

Curious about how to create an ER diagram (entity-relationship diagram or ERD) during the database design phase? We’ll explain how to understand and create ER diagrams and explore what ERD/database modeling tools can make the process quicker and easier.
An entity-relationship diagram can be considered the blueprint of a database. We use entity-relationship diagrams when we are modeling data stored (or that will be stored) in a database. ER diagrams allow discussions of requirements, such as what information needs to be stored, what aspects of the information need to be secured, and how the information is linked together. During and after the design process, database architects and others review this blueprint to make sure that all important considerations have been taken into account.
Plus, ER diagrams promote discussions around content with business stakeholders and others, helping the designers ensure that the database will meet its users’ needs. So, let’s talk about what ERDs are and how you can create them.
What Is an Entity-Relationship Diagram?
An entity-relationship diagram is essential to data modeling and database design. It is the basic design upon which we build a database. The ER diagram consists of:
- Entities, or the data that we need to store. This can be a person, place, thing, process, etc. In a retailer database, customers, products, and orders are all entities.
- Attributes, or the characteristics of the entities. These are details that add information about each entity. For example, a customer entity would include attributes like the customer’s first and last name, their email address or phone number, and their account number. If you're unsure about these concepts, refer to this article that describes the difference between entities and attributes.
- Relationships, or how data in two entities is related. For example, there would be a relationship between the order entity and the customer entity, as customers place orders.
When we bring these aspects together, we have the key element of data modeling: an ER diagram. For more details, see our article on what an ERD is or this ER Diagram Cheat Sheet.).
Database designers need to ensure that the data model has covered the key items and that they will not need to make major changes after work has been done on the surrounding software and environment. This article has many convincing arguments on why you need data modeling if you’d like a more detailed explanation.
And remember, like a blueprint, it is important to have a nice clean description of what the database model is, so that the result is properly built: you wouldn't want your house to be built based on sloppy, unclear, or unreadable blueprints. Strive for a nice clean, clear, and understandable ERD by following these 7 tips to improve your database diagram layout.
Types of ERDs
ERDs come in three types; each one is built on top of the previous, simpler model. These types include the:
- Conceptual Data Model. This is an abstract, high-level design. It’s often used to define, describe, and organize the most general business rules and processes. Since it’s usually developed for a business audience, it will show only entities and their relationships.
- Logical Data Model. This is more complicated and detailed than the conceptual model. Besides showing the entities and the relationships between them, the logical data model defines all the attributes and their details – such as the type of data stored (e.g. integer, text, date, etc.), whether the attribute can be left blank (aka optionality or nullability) and data length (i.e. how much storage space to reserve for each field). A logical model is basically a conceptual model with more details.
- Physical Data Model. This moves the model from a logical design to an implementation-specific version for a specific database management system. This is the final phase of data modeling; all the primary keys, foreign keys, indices, user roles, authorizations, stored procedures, etc. are defined.
Again, if you are unsure about these concepts, refer to this article about the different types of models or this article about moving from logical to physical models.
Drawing an ER Diagram
One place to start plotting an ERD is a whiteboard. But at some point, you will need to create a well-documented and precise blueprint of the data model; for that, you will need a database modeling tool. There are many ER diagramming tools available; check out this list of online data modeling tools and this list of the best online database diagram tools for some ideas.
Some people use common drawing programs to model data. The advantage that I see with a dedicated data modeling and ERD tool is that it is specifically built for this task. For example, dedicated ERD tools will validate the model that you are creating to ensure that it is correct; generic tools like Draw.io will not. And with a database design tool, you don't need to worry about the exact notation. You can focus on the design while the modeling tool implements entity-relationship diagram (ERD) notations and symbols.
I will use Vertabelo to make both logical and physical models as a demonstration. If you need to make a conceptual model, just start with fewer details on the logical model. Here is a simple, incomplete logical data model of customers and their addresses, orders and the ordered products, and invoices for the orders.
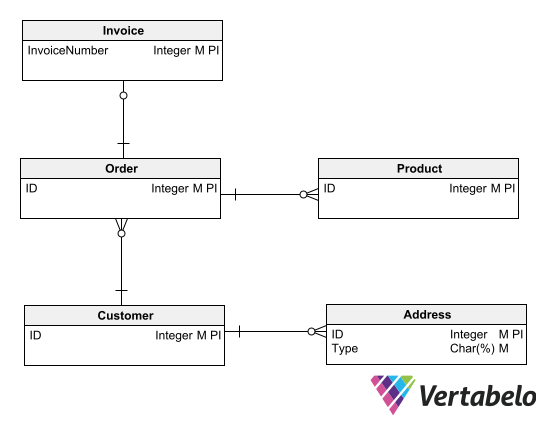
This logical model gives a starting point for discussions during the design work. You will notice that a customer can have multiple addresses; why? Well, they might have a shipping address, a billing address, a business address, or whatever. So, we mark each of those addresses with a Type. As the design process continues, we see that we need a more detailed structure to manage this information and more attributes associated with each entity, so we flesh out those details.
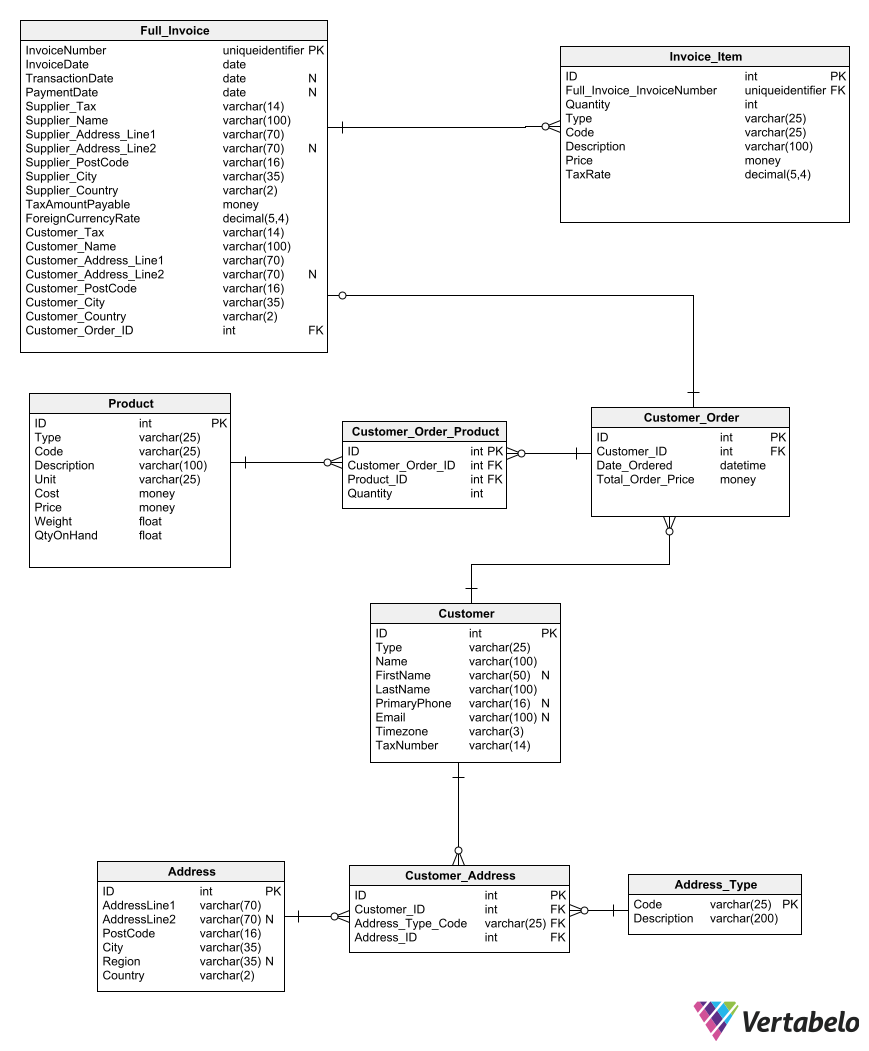
Our simple logical model grows more complicated as we create the physical data model for the database management system that we will use. This is where an ERD tool really helps you manage the complexity.
Document and Share Your Model
When you’re making a data model, your reasoning and decisions seem obvious. However, there is a good chance that you won't remember those obvious decisions later on. So, make it easy on yourself. Choose appropriate names for tables and columns and make the usage of each object clear. You can also add notes to your model. You will notice that the physical model above is completely lacking in notes – not a good practice.
The Vertabelo ERD tool allows collaboration so that you can share your models and multiple users can work on them. These collaborative tools open up the ability to more effectively design and develop your data model. Multiple users can review and contribute to the work to improve the quality and get the design down more quickly without needing to share files back and forth.
An ER Diagram is a Living Document
An ER diagram should also be a living object: it needs to be kept up-to-date with the actual database so that it matches how the database has actually been built and has evolved over time. In this way, an ERD will be the documentation for the live database; then the ERD can help with other database administration activities like optimization and debugging if there are issues.
Your "end game" in data modeling will be to have a physical model from which you can create your database. Once you're ready to turn your model into a real database, Vertabelo can generate the SQL Data Definition Language (DDL) file for you. In addition, Vertabelo has version control so that you can maintain separate versions of your physical model. It also has the ability to automatically generate SQL scripts to migrate your database between different versions of your model.
Another nice Vertabelo feature that I have used more than once is reverse engineering. This allows you to build a data model from an existing database or DDL script. Not all of my colleagues were thoughtful enough to keep their data models up-to-date, so I can take the actual, current database definitions and reverse engineer what the current database model is. I would refer you to this article if you need to turn a data definition into a model.
Next Steps with ER Diagrams
Data modeling by creating an ER Diagram is not rocket science if you use the right database modeling tool. Database design can be overwhelming when you start, but ERD tools are designed to make the task easier and to make it easier to keep your models up-to-date.
Once you've gotten started, consider investing time in learning the best practices of database design; in particular, take a look at this article on database design best practices and tips for better database design.
