

A comprehensive guide to database schema diagrams, with 10 illuminating examples.
A schema diagram is a compelling visual representation of a database system's structure and organization. It functions as a blueprint for how entities, attributes, and relationships within a database are interconnected. This article is intended to demystify schema diagrams and provide you with a comprehensive understanding of their purpose and utility. Whether you are a database administrator, a software developer, or simply inquisitive about the inner workings of databases, this guide is for you. It defines database tables, columns, and their relationships.
Schematic diagrams are typically created using a standard set of symbols representing various categories of database objects. A rectangle, for instance, represents a table; a line represents the relationship between two tables, and a diamond represents an entity. In this guide, we will examine the fundamental concepts and components of schema diagrams. We will walk you through the process of creating a schema diagram from scratch and highlight its essential components.
In data management and software engineering, schema diagrams serve as pivotal tools, lending clarity and structure to otherwise complex data environments. In essence, a schema diagram is a visual representation of structured data, illustrating how each element interacts and relates with others. Ten real-world applications of schema diagrams, spanning from small-scale projects to enterprise-level systems, will be used as examples throughout this article.
What Is an Entity-Relationship Diagram?
The term "Entity-Relationship Diagram" (ER diagram or ERD) is a critical concept in data management and software engineering. It is the foundation of schema diagrams, which serve as blueprints for database design and administration. But what is an ERD, and how does it fit into the larger schema diagram picture?
ER diagrams are a type of schema diagram primarily employed in database design. It graphically represents the entities in a system and the relationships between them. This intuitive design facilitates the communication of complex data structures, making ERDs indispensable for data-related initiatives.
Entities (which can be objects or concepts), their attributes (properties or characteristics), and the relationships between them are the components of ERDs. They are particularly useful in the following scenarios:
- Collecting requirements for a new system: ER diagrams help translate business requirements into a visual map, aiding in system design.
- Communication with business people: Given their graphical nature, ER diagrams are easily understood by both technical and non-technical stakeholders.
- Designing a new database: ER diagrams provide a high-level view of the structure and relationships of a database.
- Database debugging: When issues arise, ER diagrams can assist in identifying problems in the relationships between entities.
- Documentation of an existing database: ER diagrams serve as excellent tools for capturing the design of a database for future reference or training purposes.
Conceptual, logical, and physical diagrams represent the three levels of abstraction in database design and are critical steps in structuring and organizing data effectively. Each level provides a different perspective, starting from a high-level conceptual overview to a detailed, implementation-specific physical schema.
A conceptual diagram (shown below) represents the highest level of abstraction, providing a bird's eye view of the overall system. It identifies the significant entities within the system and the relationships among them. However, this level doesn't delve into detail about attributes or how the database will be implemented. It is most beneficial during the early stages of a project, where the main goal is to outline the broad scope and the basic associations among entities.
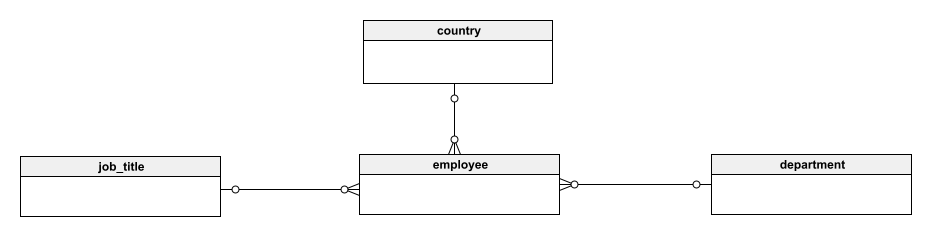
Conceptual diagram
Logical diagrams sit at the middle level of abstraction, providing a more detailed look at the system's structure. It includes all entities, relationships, and attributes, reflecting how they interact. Unlike the conceptual level, it provides a greater degree of specificity about data types, primary keys, and constraints. However, it is still independent of the specific technologies that will be used to implement the database. A logical diagram looks like this:
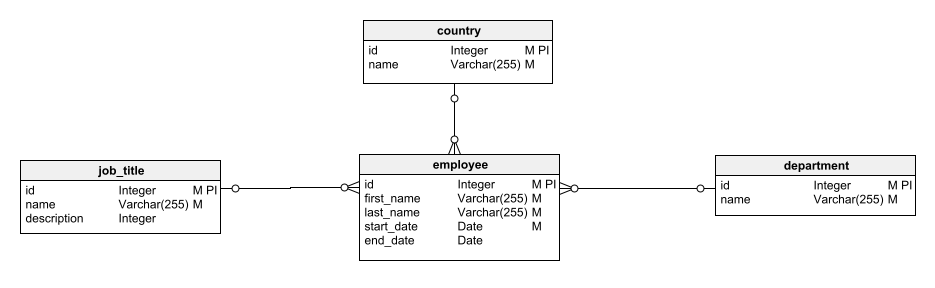
Logical diagram
Physical diagrams represent the lowest level of abstraction, detailing exactly how the database will be implemented. It defines the tables, columns, data types, constraints, primary and foreign keys, indexes, triggers, and other database-specific elements. This level is often database-specific, incorporating the details and constraints of the particular database management system (DBMS) being used. It provides the blueprint for the database's construction and is typically developed by database administrators and developers right before the implementation phase. Here’s an example:
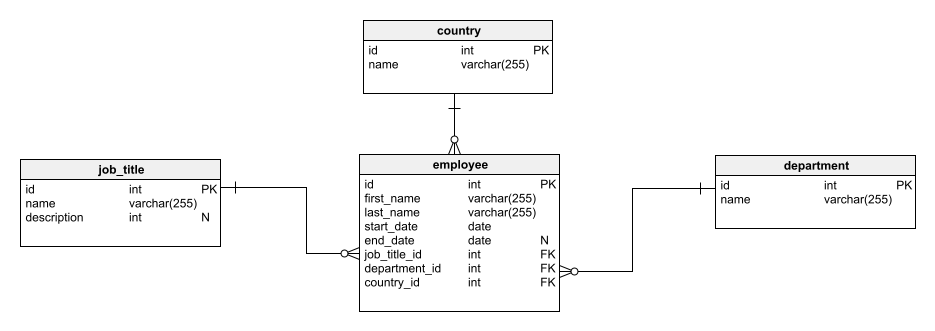
Physical diagram
The building blocks of a schema diagram include:
- Entities: These are the objects or concepts about which data is stored. Entities are typically represented as rectangles.
- Attributes: These are the properties or characteristics of entities. Attributes are usually represented as ovals connected to their respective entities or as lists inside the entity rectangle.
- Relationships: These show how two or more entities interact with each other. Relationships are illustrated by a line connecting the related entities.
- Cardinality: This defines the numerical attributes of the relationship between two entities. The cardinality could be one-to-one, one-to-many, or many-to-many.
A well-constructed schema diagram can provide an overview of the database, allowing individuals, teams, or entire organizations to understand how data is stored, accessed, and manipulated. This helps in software development, data modeling, data analysis, and systems design.
ERD Diagram Notations
Crow's Foot Notation
Crow's Foot notation is arguably the most readable style of all ER diagram notations. It uses three distinct symbols to represent cardinality: a straight line, a three-pronged "crow's foot," and a circle (which signify one, many, and zero or many, respectively). These symbols are used at the end of the relationship lines, thus depicting the cardinality and optionality of the relationship between entities. This notation is named after its 'crow's foot' symbol, which indicates the "many" side in the relationship between two entities.
UML (Unified Modeling Language) Notation
UML is a popular and versatile modeling language that’s widely employed in the field of software engineering. It's used to describe the design and architecture of various software systems. UML notation for ER diagrams is an adaptation of this language, with the key elements being classes – i.e. entities, which have attributes and operations. Associations are used to show relationships between classes, with multiplicity used to denote cardinality. This multiplicity (one-to-one, one-to-many, or many-to-many) is depicted at either end of the association line.
Barker's Notation
Barker's notation is a part of the family of notations developed by Richard Barker in the 1980s while at Oracle. It is used primarily in Oracle's CASE*Method, an approach to system development. Barker's notation models entities, attributes, and relationships. It uses a rectangle for entities and ellipses for attributes. Relationships are shown with a line connecting entities, and cardinality is shown with a cross-foot (for one) and a circle (for many). This notation emphasizes the business aspects of the system and is widely used in enterprise database modeling.
IDEF1X Notation
IDEF1X stands for Integration Definition for Information Modeling, a standard notation for modeling relational databases. Developed in the 1980s by the U.S. Air Force, it is known for its strict rules and conventions. In IDEF1X notation, entities are shown as rectangles, with their attributes listed within. Relationships are displayed as lines between entities, with the relationship role and constraints specified. Cardinality is denoted by placing the notation '(0,N)', '(1,N)', or '(1,1)' on the line to describe the range of possible related instances.
IDEF1X is often favored for its expressiveness and rigor, but it can be more challenging for beginners to grasp.
Examples of Schema Diagrams
Let's delve into 10 examples of schema diagrams, showcasing their wide array of applications across different domains. We will be using the Crow’s Foot notation in our diagrams, as it’s the one you’re most likely to see in an ERD.
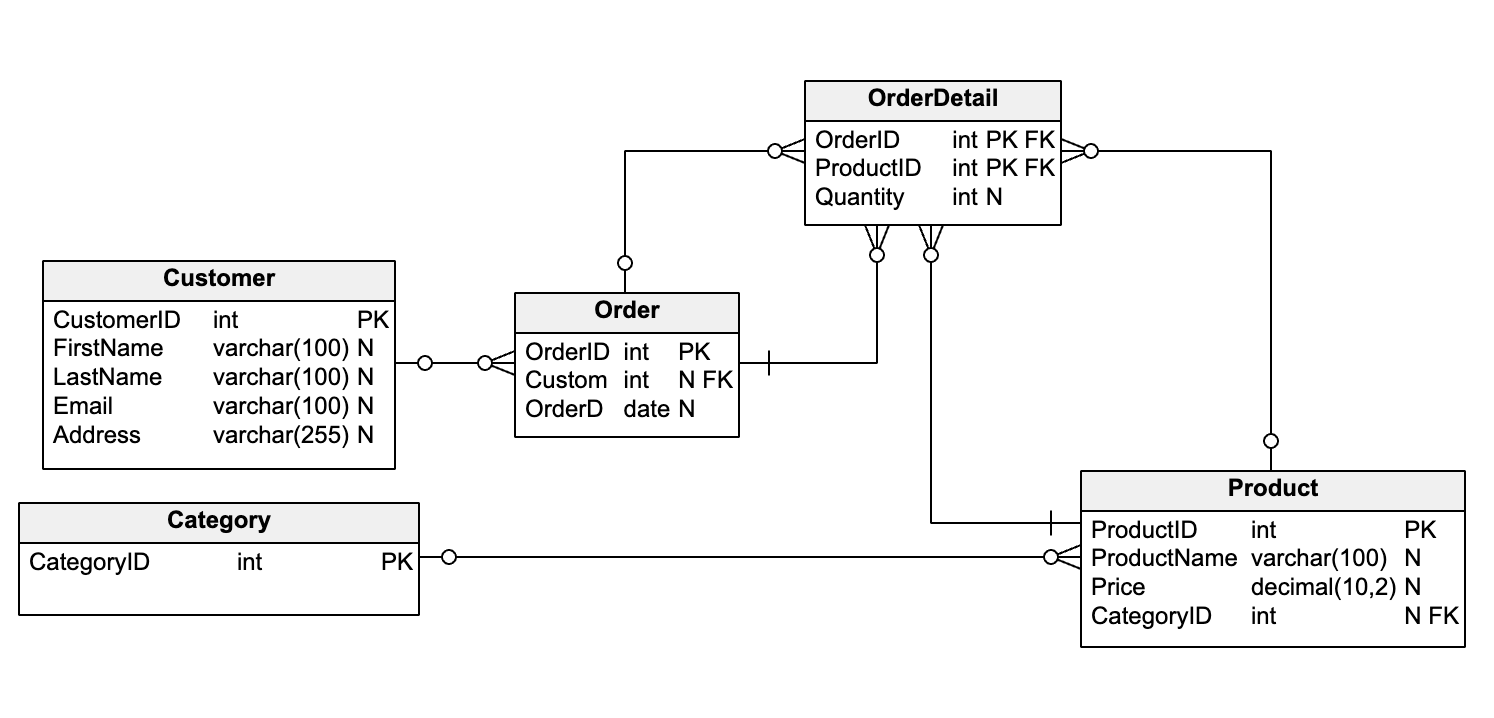
Example 1: Online Shopping System
Entities: Customer, Order, Product, Category, OrderDetail.
Relationships: Customer 'places' Order, Order 'contains' Product, Product 'belongs to' Category, OrderDetail 'connects' Order and Product.
In this schema:
- The
Customertable represents the customers who place orders. - The
Categorytable represents the categories to which products belong. - The
Producttable represents the products that can be ordered. Each product belongs to a category, represented by the foreign keyCategoryID. - The
Ordertable represents the orders placed by customers. Each order is placed by a customer, who is represented by the foreign keyCustomerID. - The
OrderDetailtable represents the many-to-many relationship between orders and products. Each row in this table represents a product contained in an order and the quantity of that product in the order.
Description: This diagram models an online shopping system. Customers place orders, each of which contains one or more products. Products belong to categories for easy classification and search.
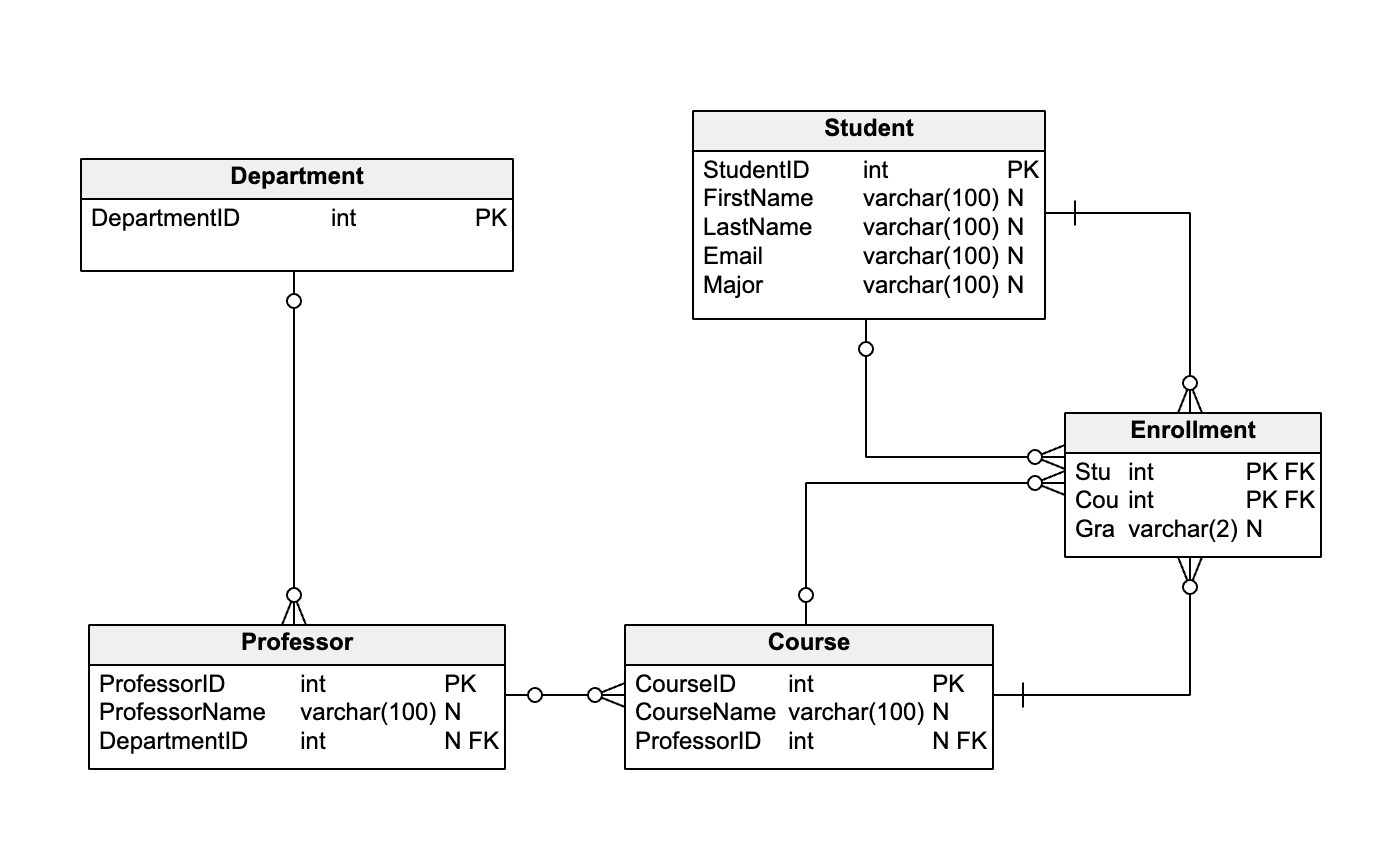
Example 2: University Database
Entities: Student, Course, Professor, Department, Enrollment.
Relationships: Student 'enrolls in' Course, Course 'taught by' Professor, Professor 'works in' Department.
In this schema:
- The
Studenttable represents the students who enroll in courses. - The
Departmenttable represents the departments in which professors work. - The
Professortable represents the professors who teach courses. Each professor works in a department, which is represented by the foreign keyDepartmentID. - The
Coursetable represents the courses in which students enroll. Each course is taught by a professor, who is represented by the foreign keyProfessorID. - The
Enrollmenttable represents the many-to-many relationship between students and courses. Each row in this table represents a student enrolled in a course and the grade they received in that course.
Description: This diagram models a university database. Students enroll in courses, which are taught by professors. Professors work in departments, indicating their specialties.
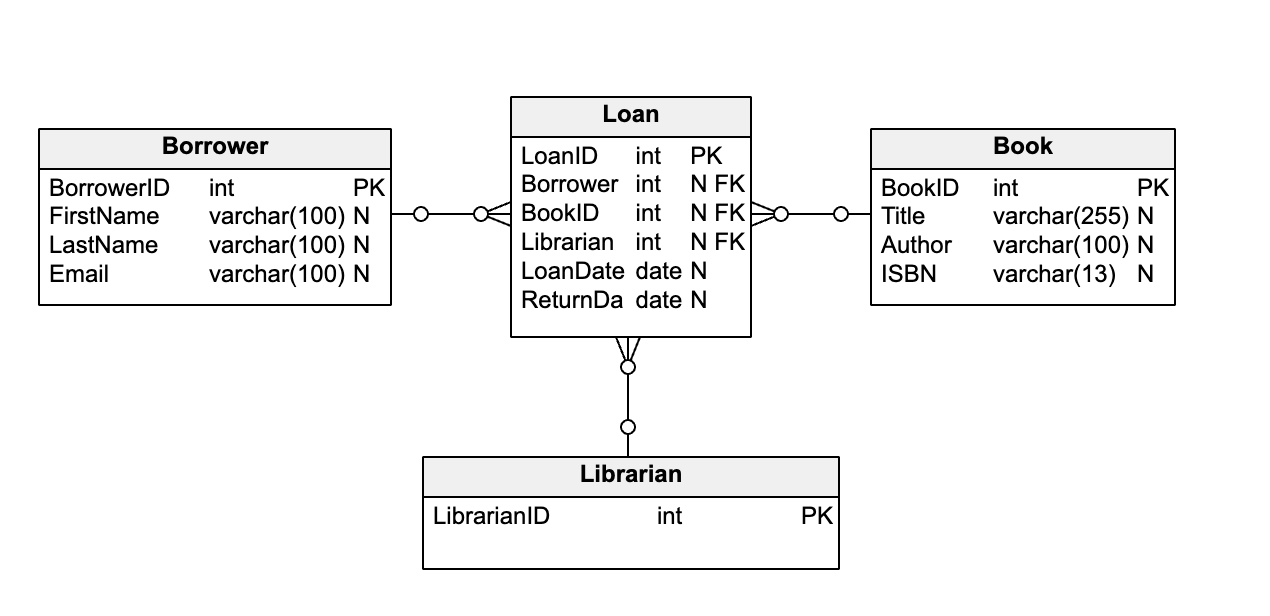
Example 3: Library Management System
Entities: Book, Borrower, Loan, Librarian.
Relationships: Borrower 'borrows' Book, Loan 'recorded by' Librarian.
In this schema:
- The
Borrowertable represents the library patrons who borrow books. - The
Librariantable represents the librarians who record the book loans. - The
Booktable represents the books that can be borrowed. - The
Loantable represents all the loan (i.e. borrowing) transactions. Each loan is associated with a borrower (who borrowed the book), a book (that was borrowed), and a librarian (who recorded the loan); these are represented by the foreign keysBorrowerID,BookID, andLibrarianIDTheLoanDateandReturnDatefields represent the date when the book was borrowed and the date when it was returned.
Description: This diagram depicts a library management system. Borrowers (library patrons) can borrow books. Each loan transaction, which pairs a borrower with a book, is recorded by a librarian.
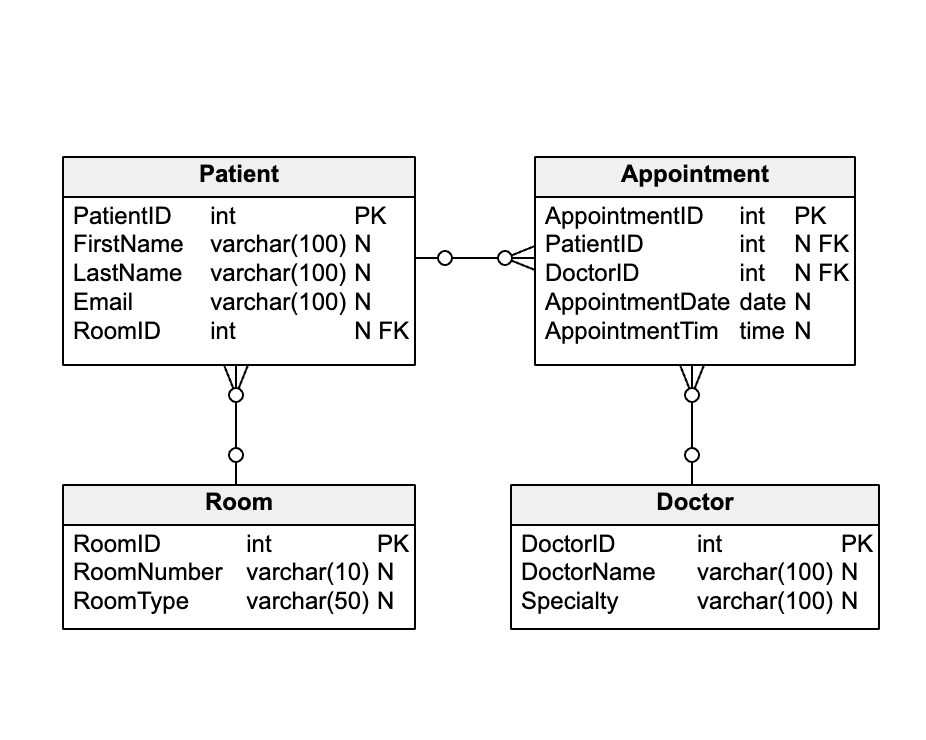
Example 4: Hospital Management System
Entities: Patient, Doctor, Appointment, Room.
Relationships: Patient 'makes' Appointment, Appointment 'is with' Doctor, Patient 'assigned to' Room.
In this schema:
- The
Patienttable represents the patients who make appointments and are assigned to rooms. Each patient is assigned to a room, which is represented by the foreign keyRoomID. - The
Doctortable represents the doctors with whom patients make appointments. - The
Roomtable represents the rooms to which patients are assigned. - The
Appointmenttable represents the appointments made by patients. Each appointment is associated with a patient (who made the appointment) and a doctor (with whom the appointment was made). These are represented by the foreign keysPatientIDandDoctorID. TheAppointmentDateandAppointmentTimefields represent the date and time of the appointment.
Description: This diagram models a hospital management system. Patients make appointments with doctors and are assigned to rooms during their hospital stays.
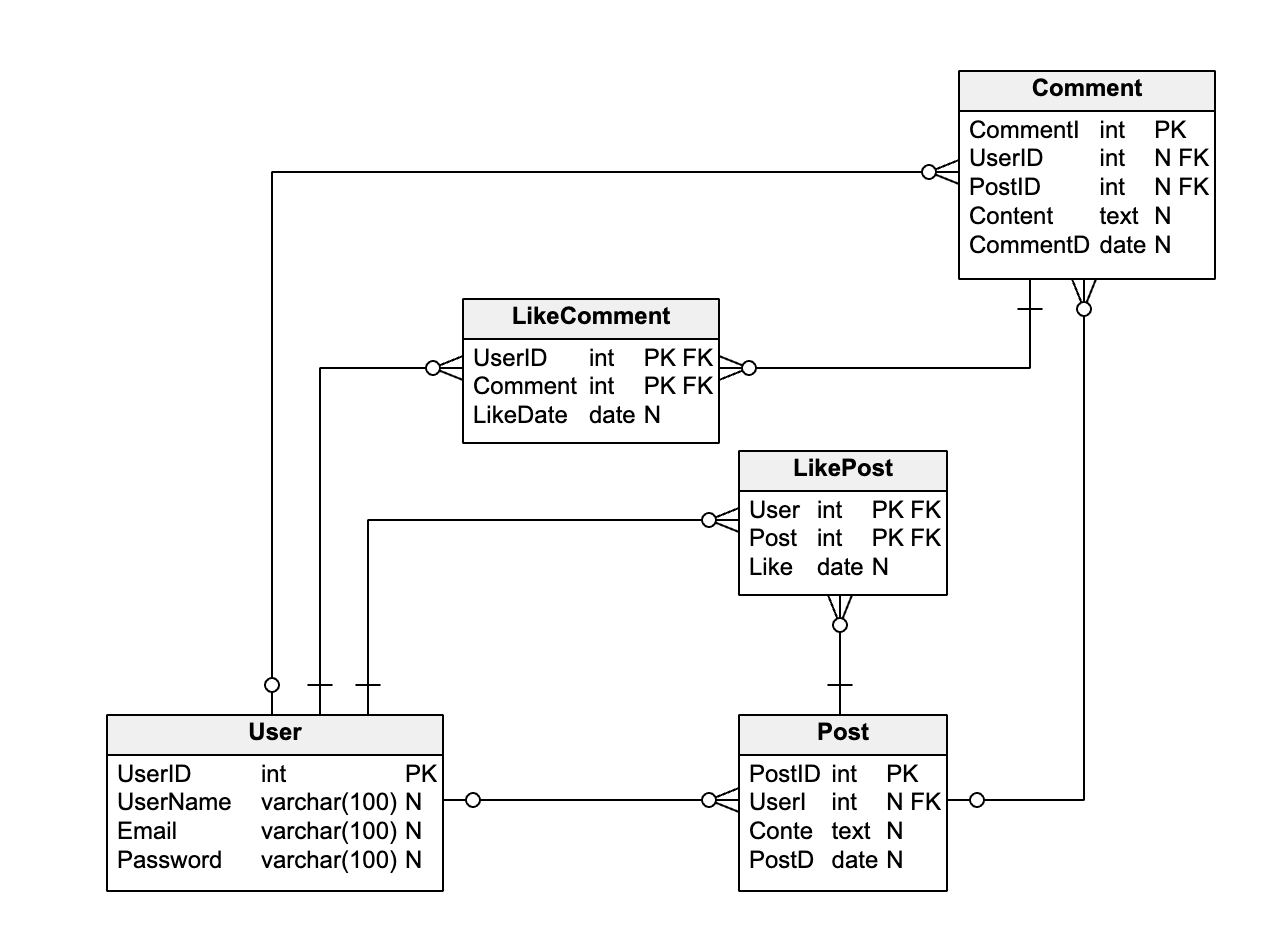
Example 5: Social Media Platform
Entities: User, Post, Comment, LikeComment, LikePost.
Relationships: User 'creates' Post, User 'makes' Comment, User 'gives' LikeComment or LikePost.
In this schema:
- The
Usertable represents the users who create posts, make comments, and give likes. - The
Posttable represents the posts created by users. Each post is created by a user, who is represented by the foreign keyUserID. - The
Commenttable represents the comments made by users on posts. Each comment is made by a user on a post; this is represented by the foreign keysUserIDandPostID. - The
LikePosttable represents the likes given by users to posts. Each like is associated with a user (who gave the like) and a post (that was liked). This is represented by the foreign keysUserIDandPostID. - The
LikeCommenttable represents the likes given by users to comments. Each like is associated with a user (who gave the like) and a comment (that was liked), represented by the foreign keysUserIDandCommentID.
Description: This diagram represents a social media platform. Users can create posts, comment on posts, and give likes to posts and comments.
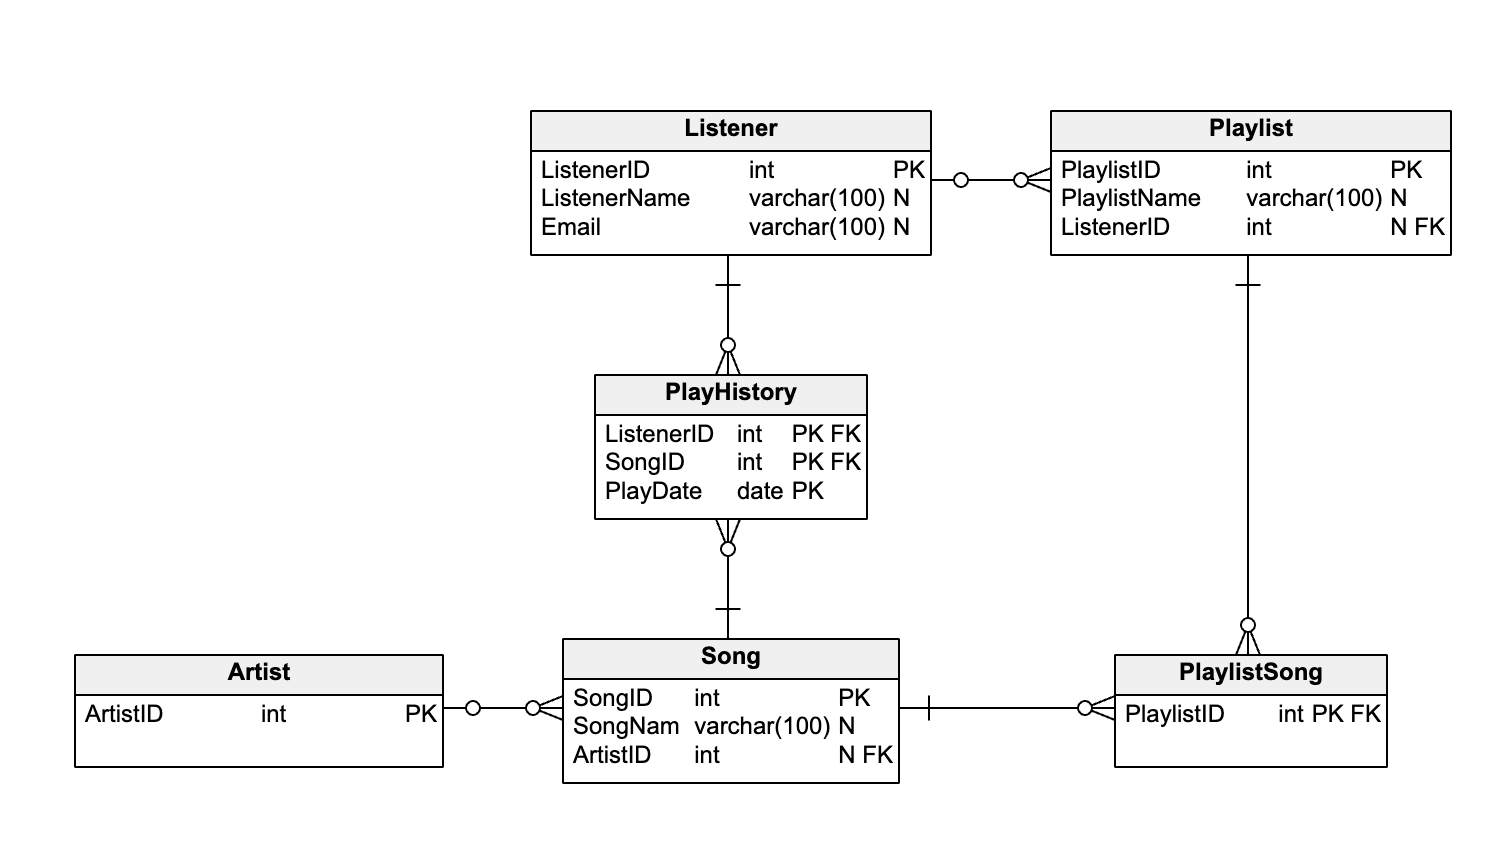
Example 6: Music Streaming Platform
Entities: Listener, Song, Playlist, Artist, PlayHistory, PlaylistSong.
Relationships: Listener 'plays' Song, Song 'is included in' Playlist, Song 'is by' Artist, PlayHistory 'records' Listener and Song, PlaylistSong 'records' Playlist and Song.
In this schema:
- The
Listenertable represents the listeners who play songs and create playlists. - The Artist table represents the artists who perform songs.
- The
Songtable represents the songs that listeners can play. Each song is performed by an artist, who is represented by the foreign keyArtistID. - The
Playlisttable represents the playlists created by listeners. Each playlist is created by a listener, who is represented by the foreign keyListenerID. - The
PlaylistSongtable represents the many-to-many relationship between playlists and songs. Each row in this table represents a song included in a playlist. - The
PlayHistorytable represents the songs played by listeners. Each row in this table represents a song played by a listener on a specific date.
Description: This diagram models a music streaming platform. Listeners play songs, which are included in playlists. Songs are linked to artists, indicating who performed them.
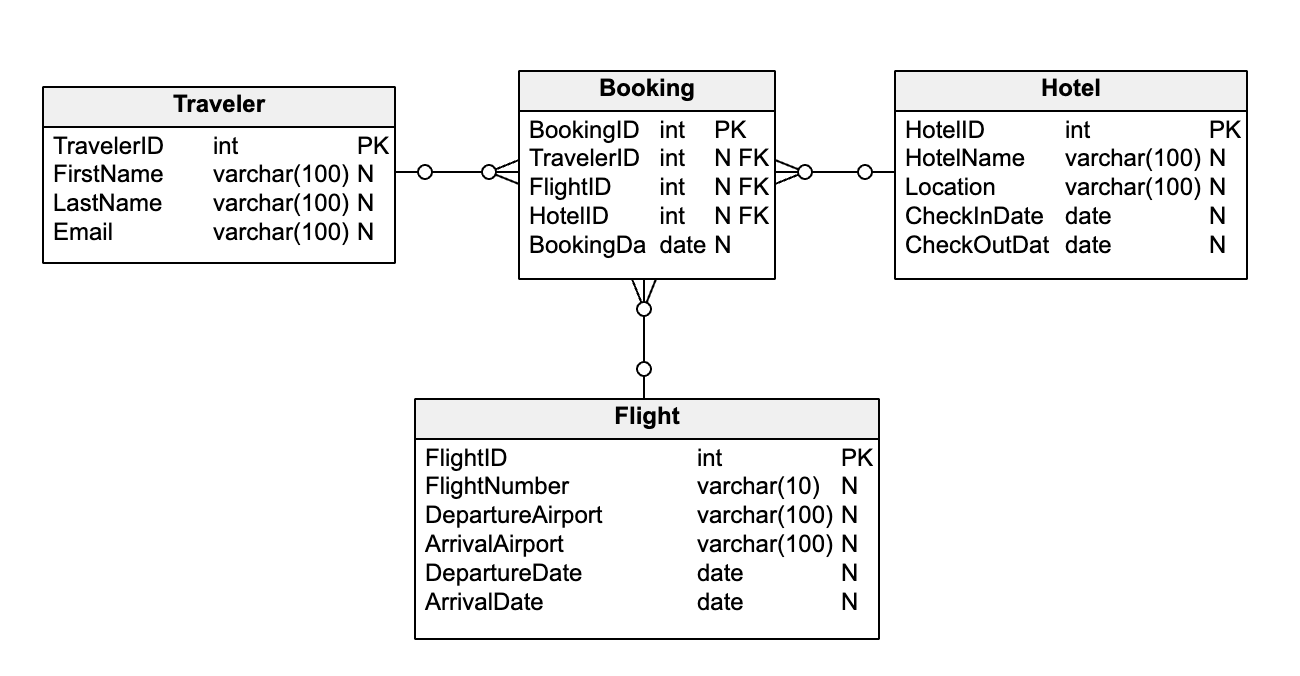
Example 7: Travel Booking System
Entities: Traveler, Flight, Hotel, Booking.
Relationships: Traveler 'makes' Booking, Booking 'is for' Flight, Booking 'is for' Hotel.
In this schema:
- The
Travelertable represents the travelers who make bookings. - The
Flighttable represents the flights that can be booked. - The
Hoteltable represents the hotels that can be booked. - The
Bookingtable represents the bookings made by travelers. Each booking is associated with a traveler (who made the booking), a flight (that was booked), and a hotel (that was booked). These are represented by the foreign keysTravelerID,FlightID, andHotelID. TheBookingDatefield represents the date when the booking was made.
Description: This diagram depicts a travel booking system. Travelers make bookings for flights and hotels.
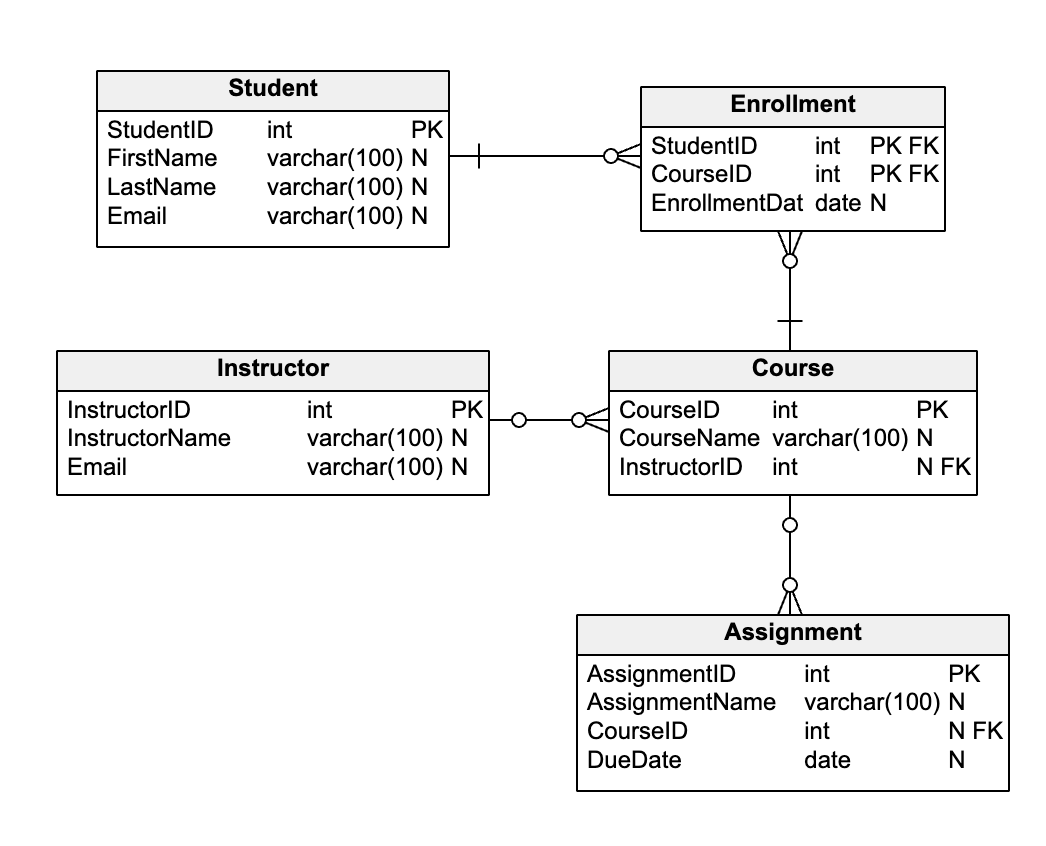
Example 8: E-Learning Platform
Entities: Student, Course, Instructor, Assignment, Enrollment.
Relationships: Student 'takes' Course, Course 'taught by' Instructor, Course 'has' Assignment, Enrollment "has" Course and Student.
In this schema:
- The
Studenttable represents the students who take courses. - The
Instructortable represents the instructors who teach courses. - The
Coursetable represents the courses that students can take. Each course is taught by an instructor, who is represented by the foreign keyInstructorID. - The
Enrollmenttable represents the many-to-many relationship between students and courses. Each row in this table represents a student taking a course. - The
Assignmenttable represents the assignments for each course. Each assignment is associated with a course, which is represented by the foreign keyCourseID. TheDueDatefield represents the due date for the assignment.
Description: This diagram models an e-learning platform. Students take courses, which are taught by instructors. Each course may have one or more assignments.
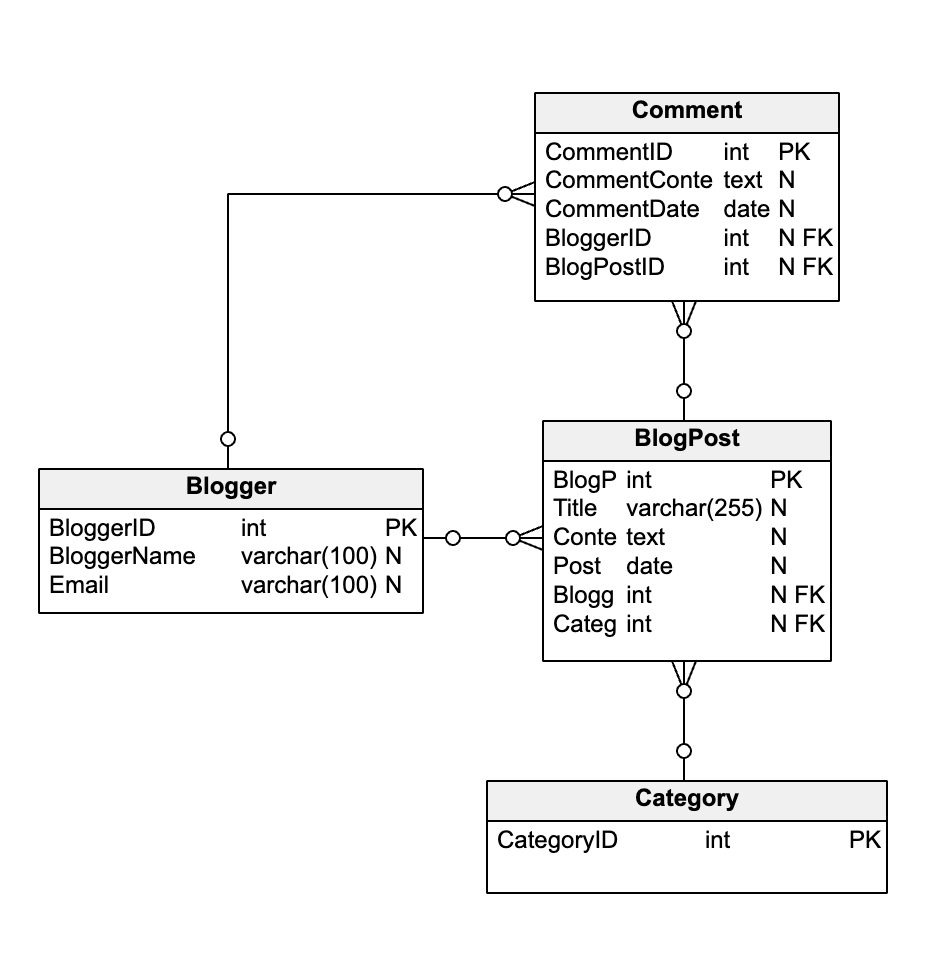
Example 9: Blogging Platform
Entities: Blogger, BlogPost, Comment, Category
Relationships: Blogger 'writes' BlogPost, BlogPost 'has' Comment, BlogPost 'is under' Category.
In this schema:
- The
Bloggertable represents the bloggers who write blog posts. - The
Categorytable represents the categories under which blog posts are organized. - The
BlogPosttable represents the blog posts written by bloggers. Each blog post is written by a blogger and is under a category. These are represented by the foreign keysBloggerIDandCategoryID. - The
Commenttable represents the comments made by bloggers on blog posts. Each comment is made by a blogger on a blog post; these are represented by the foreign keysBloggerIDandBlogPostID.
Description: This diagram represents a blogging platform. Bloggers write blog posts, each of which may have comments from readers. Blog posts are organized under categories.
Example 10: E-commerce Platform
Entities: Shopper, Product, Cart, Order, OrderItem, CartItem
Relationships: Shopper 'adds' Product to Cart, Shopper 'places' Order, Order 'has' OrderItem, Cart 'has' CartItem
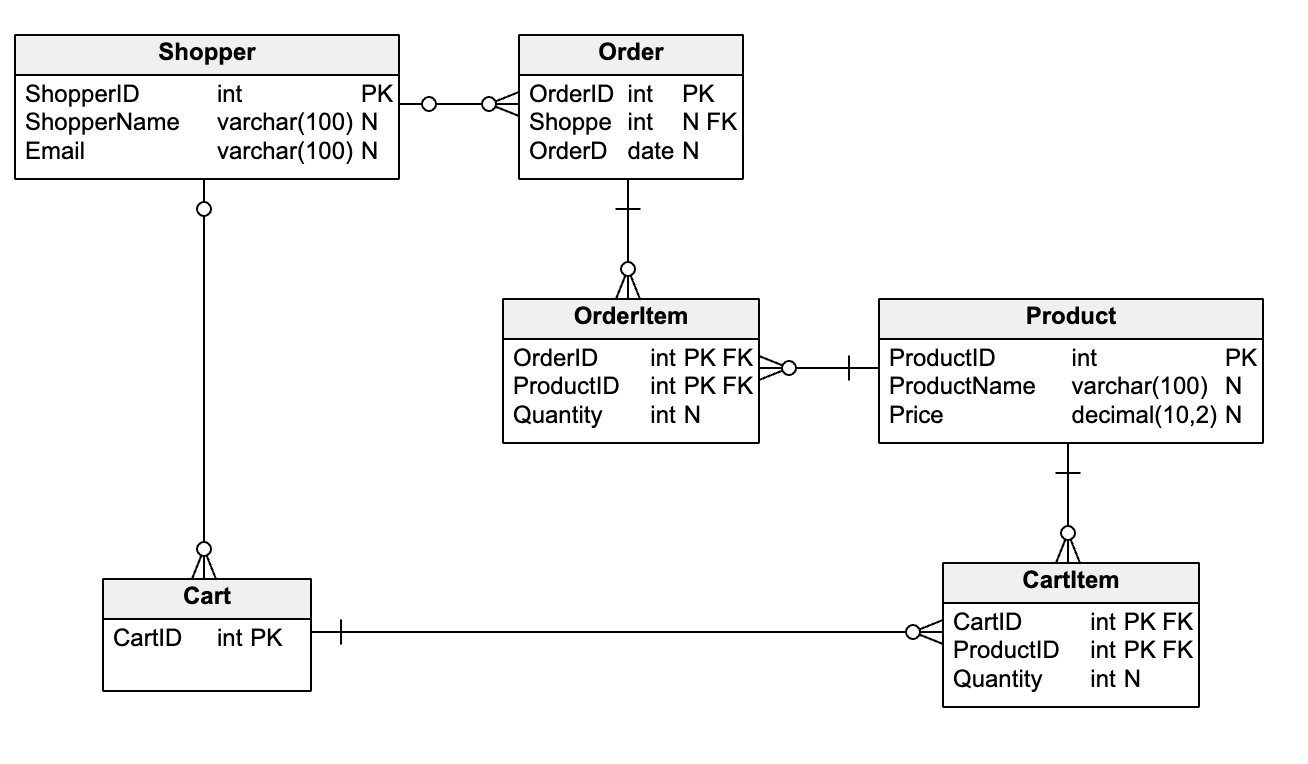
In this schema:
- The
Shoppertable represents the shoppers who add products to their carts and place orders. - The
Producttable represents the products that can be added to carts. - The
Carttable represents the carts to which shoppers add products. Each cart is associated with a shopper, who is represented by the foreign keyShopperID. - The
CartItemtable represents the many-to-many relationship between carts and products. Each row in this table represents a product added to a cart and the quantity of that product in the cart. - The
Ordertable represents the orders placed by shoppers. Each order is placed by a shopper, who is represented by the foreign keyShopperID. - The
OrderItemtable represents the many-to-many relationship between orders and products. Each row in this table represents a product included in an order and the quantity of that product in the order.
Description: This diagram models an e-commerce platform. Shoppers add products to their carts and place orders. Each order translates into a purchase transaction.
Learn More About Schema Diagrams with Vertabelo
In conclusion, ER diagrams and schema diagrams serve as pivotal tools in the world of data management, software engineering, and database design. Whether you're a data analyst, a software engineer, or someone looking to visualize the flow of information, understanding these diagrams is essential. With data design platforms like Vertabelo, creating, understanding, and managing these diagrams becomes an easy task.
If you’d like to learn more about database schema diagrams, check out the database modeling, example ER diagrams and data modeling sections of our blog! You’ll find detailed versions of many of the ER diagrams presented above and a lot more.
