 -
8 minutes read
-
8 minutes read
The Power of ERD Diagrams in Database Design: A Step-by-Step Guide for Beginners

What is an entity-relationship diagram? How are they used in database design? And how can you build your own ERDs? Read on to find out.
In this article, we will dive into the importance of entity-relationship diagrams (ERDs), why they are essential in database design, and how they enable data organization based on specific relationships. ERDs empower users to extract meaningful insights, establish connections, and generate structural overviews from large datasets.
What Is an ERD Diagram?
ERD is short for entity-relationship diagram; they are also known as ER diagrams. An ERD is a graphical representation of how to store data within a system; it shows the entities that hold data and the relationships between entities. It is essentially a graphical tool for database design. The main purpose of an ERD is to offer a clear overview of the structure of the data within a system, which can be helpful when designing or redesigning a database.
How Do You Design an ER Diagram?
Designing an ERD involves a methodical process that starts with identifying the entities in the system and their attributes as well as the relationships between entities. Let's go a bit deeper into the concept of entities, attributes, and relationships.
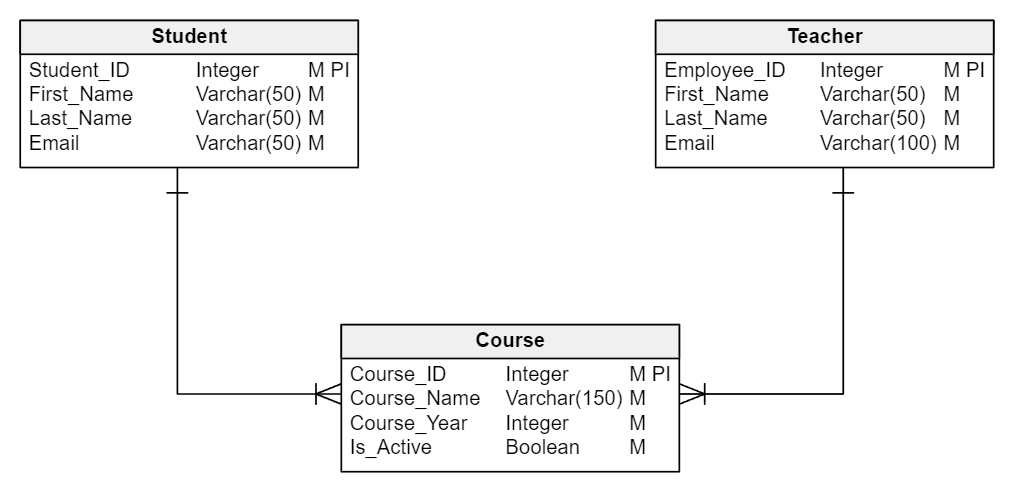
Below you can see an example of a diagram showing entities, their attributes, and the relationships between entities. We’ll go into more detail about each of these..
Entities
Entities are the main objects or concepts represented in a database. They are usually distinguishable real-world objects or abstractions of real-world objects or concepts. For example, in a university database, the entities could be Students, Courses, and Teachers. Each entity in the data model will become a table in the final database.
Attributes
Attributes are the properties or characteristics of an entity; they hold its data. For example, a Student entity could have attributes like Student_ID, First_Name, Last_Name, and Email. Each attribute of an entity becomes a column in a table in the database.
Relationships
Relationships describe how entities interact with each other. These interactions are usually representations of verbs or actions in the real world. For example, a relationship could be that a Student (Entity) Enrolls (Relationship/Action) in a Course (Entity).
Relationships are represented as connecting lines between entities. In the above diagram, the relationship connecting the Student and Course entities signifies that the student is “enrolled in” a course. We can think of relationships as a verb or an action made by one entity in relation to another entity. Similarly, the relationship between Teacher and Course could be described as “teaches course”.
When Do You Need an ERD?
ER diagrams are invaluable tools in various situations during the system lifecycle, particularly when doing data modeling and designing databases. Here are some instances when you might need an ER diagram:
- Collecting requirements for a new system: When developing a new system, ER diagrams can aid in understanding and recording the system's requirements. They provide a clear and concise way to represent the different entities in the system, their attributes, and the relationships between them.
- Communicating with business people: Diagrams are often easier to understand than text, making ERDs a useful tool for explaining complex database designs to non-technical stakeholders. They provide a visual overview of the system that can be understood regardless of technical proficiency.
- Designing a new database: ER diagrams are essential in the initial design phase of a database. They allow you to structure the database properly, ensuring that all data is accurately represented and relationships between entities are correctly defined.
- Database debugging: if you're having issues with a database, an ERD diagram can help you pinpoint where the problems are. A visual representation of the database helps you more easily understand its structure and how its parts interact; this makes identifying any mistakes or errors easier.
- Documenting an existing database: ERDs can serve as a valuable documentation tool for existing databases. They provide a comprehensive overview of the database structure, making it easier for others to understand the database's design and functionality. This is particularly useful for onboarding new team members or for reference during system upgrades or modifications.
How to Create an ER Diagram
Creating an ERD is a systematic process that involves careful analysis of the system and its components. Here's a step-by-step guide on how to create an ERD:
- Identify the entities: Start by identifying the key objects or concepts that need to be represented in the database. These become the entities in your ER diagram. Entities are usually nouns like 'Student', 'Course', or 'Teacher'.
- Identify the attributes: For each entity, list the properties or characteristics that need to be stored in the database. These are the entity’s attributes. Attributes are usually properties that describe or identify an entity. For example, a 'Student' entity may have attributes like 'Student_ID', 'First_Name', 'Last_Name', and 'Email'.
- Identify the relationships: Determine how the entities interact with each other. This helps define the relationships in the ER diagram. Relationships are verbs that describe interactions between entities. For example, a 'Student' entity 'Enrolls in' a 'Course' entity.
- Set the cardinality: The next step is to set the cardinality of the relationships, which specifies how many instances of an entity relate to each instance of another entity. Cardinalities can be one-to-one (1:1), one-to-many (1:M), or many-to-many (M:N).
- Identify and set constraints: Constraints are rules that help to ensure the integrity and accuracy of the data. They can be of different types, such as entity integrity (no duplicate rows), referential integrity (foreign key values must have a match in the corresponding table), and domain integrity (values in a column must be of a specific data type).
- Draw the ERD: Finally, represent all these elements graphically. Entities are represented by rectangles. Attributes are represented by either ovals connected to their respective entities or as line items inside the entity rectangles. Relationships are represented by lines connecting to the related entities, and cardinalities are represented on the relationship lines connecting entities.
Designing an ER diagram is an iterative process, meaning you will have to go through multiple iterations of feedback loops from stakeholders and approval stages until you end up with a model which is accepted and suitable for the business case.
What Are the Types of ER Diagrams?
ERD diagrams can be categorized into three types based on the level of abstraction: conceptual, logical, and physical. Each type serves a unique purpose and represents the data and relationships from a different perspective, at different stages during development, and for different audiences.
- Conceptual ER Diagrams: These are high-level diagrams that provide a broad overview of the system; they focus on the entities, their relationships, and the constraints that affect them. They are often used in the initial stages of database design to help establish the basic structure of the database and communicate with stakeholders. They don't usually include detailed information about attributes or the specifics of how data will be stored.
- Logical ER Diagrams: These diagrams provide a more detailed view of the system. They include entities, attributes, relationships, and key constraints. They don't concern themselves with how the data will be physically stored, but instead focus on illustrating the specific attributes of entities and the exact nature of the relationships between them. Logical ERDs are often used for data modeling and to create a blueprint of the database system.
- Physical ER Diagrams: These diagrams provide the most detailed view of the system, including specifics about how the data will be stored in the database. They consider the specific requirements of the database system being used, such as table structures, data types, primary and foreign keys, indexes, and other database-specific elements. Physical ERD diagrams are used for the actual implementation of the database.
Entity-Relationship Diagram Tools
While it's possible to sketch an ERD diagram using general-purpose drawing tools, using a dedicated ER diagram tool can provide a much smoother and more efficient experience. Such tools have specialized features that can assist in the database design process, making it quicker and more accurate.
One such tool with which you can start online data modeling is Vertabelo, an online database design and entity relationship diagram tool. Vertabelo provides a clean and responsive user interface, making it easy to create and manage ER diagrams. It supports different types of models, allowing you to switch between levels of abstraction as needed.
Some of the standout features of Vertabelo include:
- Model Validation: Vertabelo can validate your ERD in real time, highlighting any errors or issues that could potentially lead to problems down the line.
- Collaboration: Vertabelo supports collaboration between multiple users. This means that you can share your ERD models with others and they can view or edit the model as needed. This feature can be particularly helpful in larger teams, where multiple people may need to contribute to the database design.
- SQL Generation and DDL Import: Vertabelo can generate SQL scripts based on your ERD, speeding up the implementation process. It can also import DDL scripts, allowing you to create an ERD from an existing database.
- Reverse Engineering: Vertabelo can generate an ERD from an existing database, making it easier to understand and document its structure.
- Automatic Physical Model Generation: Vertabelo allows you to focus on designing your database and automates generating the final physical data model that will actually turn into code you run on your specific database engine.
By using a dedicated tool like Vertabelo, you can ensure that your ERD is accurate, effective, and easy to understand. Whether you're designing a new database or trying to understand an existing one, Vertabelo can make the process much easier.
Want to Know More About ERD Diagrams and Database Design?
Understanding and utilizing ERD diagrams in database design is only part of the field of database management. Database design is more than just building an ERD, so if you're keen to dive deeper into the world of databases and fully harness their potential, we strongly encourage you to explore the rest of our blog on database design and data modeling.
